From Trusting Timesheets to Tracking Real Progress
The biggest drain on your budget isn’t the development itself- it’s the inefficiency you can’t see. Without visibility into velocity metrics or how AI is accelerating delivery, you end up paying legacy rates for work that should take half the time.
That’s exactly why The NineHertz built transparency into every layer of delivery. Our live dashboards give you real-time access to sprint velocity, AI utilization rates, and task-level cost breakdowns- so you see exactly where every hour goes and how AI is cutting delivery timelines. No status call needed, no invoice surprises.
Lower Development Costs
Hidden Costs
More Output Per Sprint
On-Time Delivery Rate

Every Metric, Every Milestone- Fully Visible
We don’t just promise transparency- we build it into your project from day one. Every engagement ship with a real-time visibility layer that puts metrics, milestones, and costs at your fingertips.
Real-Time Dashboards
Get instant visibility into sprint velocity, feature completion status, and AI utilization rates- all updated live. No more waiting for weekly alignment calls to know where your project stands.
AI-Driven Productivity Gain
See exactly which components were built or accelerated using AI tools like Claude, Cursor, or Copilot. Track how AI is driving efficiency and compounding your cost savings sprint over sprint.
Outcome-Based Tracking
Measure progress against defined business outcomes, not arbitrary hour logs. Every deliverable is mapped to real milestones- you pay for shipped value, not logged time.
Continuous Deployment Feed
Get a live feed of every deployment, build, and release pushed to your project. Know exactly what went live, when it shipped, and what changed- without digging through changelogs.
Test Coverage
Monitor the percentage of your codebase covered by automated tests in real time. Know exactly how thoroughly every feature is validated before it ships.
Predictable FinOps
Track project spends on budget in real time with feature-level cost breakdowns. No end-of-month billing surprises- every rupee is allocated, visible, and justified before it’s invoiced.
Sprint Predictability
Compare planned deliverables against actual output every sprint. See your team’s predictability percentages and how consistently commitments are being met.
Defect Density (Bugs per Module/Release)
Monitor the number of bugs detected per module or release cycle. Identify quality trends early and ensure every release meets your reliability standards.
Compliance Adherence
Track how closely your project follows required regulatory and industry standards. Get real-time compliance percentages so nothing slips through before launch.
How Visibility Gets Wired Into Your Project?
For us, transparency is not a feature we toggle on. It’s part of the infrastructure. Every project is wired for visibility before development even begins.
How You Work Today vs. How You Could
The Old Way (Black Box)
- Paying for unstructured resource utilization data.
- Relying on weekly or monthly status reports for project progress.
- Accepting vague explanations for missed deadlines.
- Treating the development process as a vendor’s problem.
- Preferring fixed-scope contracts with no visibility.
The ContinuumAI Way
- Full visibility into use of AI for your project’s development.
- Real-time access to progress, sprint velocity, and quality metrics.
- Built around defined outcomes and shipped features
- Development as a partnership and involvement at every stage.
- Every cost is justified, mapped, and visible.
Get a walkthrough of our live transparency dashboard and see exactly how we track velocity, AI output, and project spend in real time.
Latest Thinking
Perspectives on AI, engineering, and the future of software development
Challenges and Tricks for iBeacon App Development
In this current era, it is easier to locate a food court…
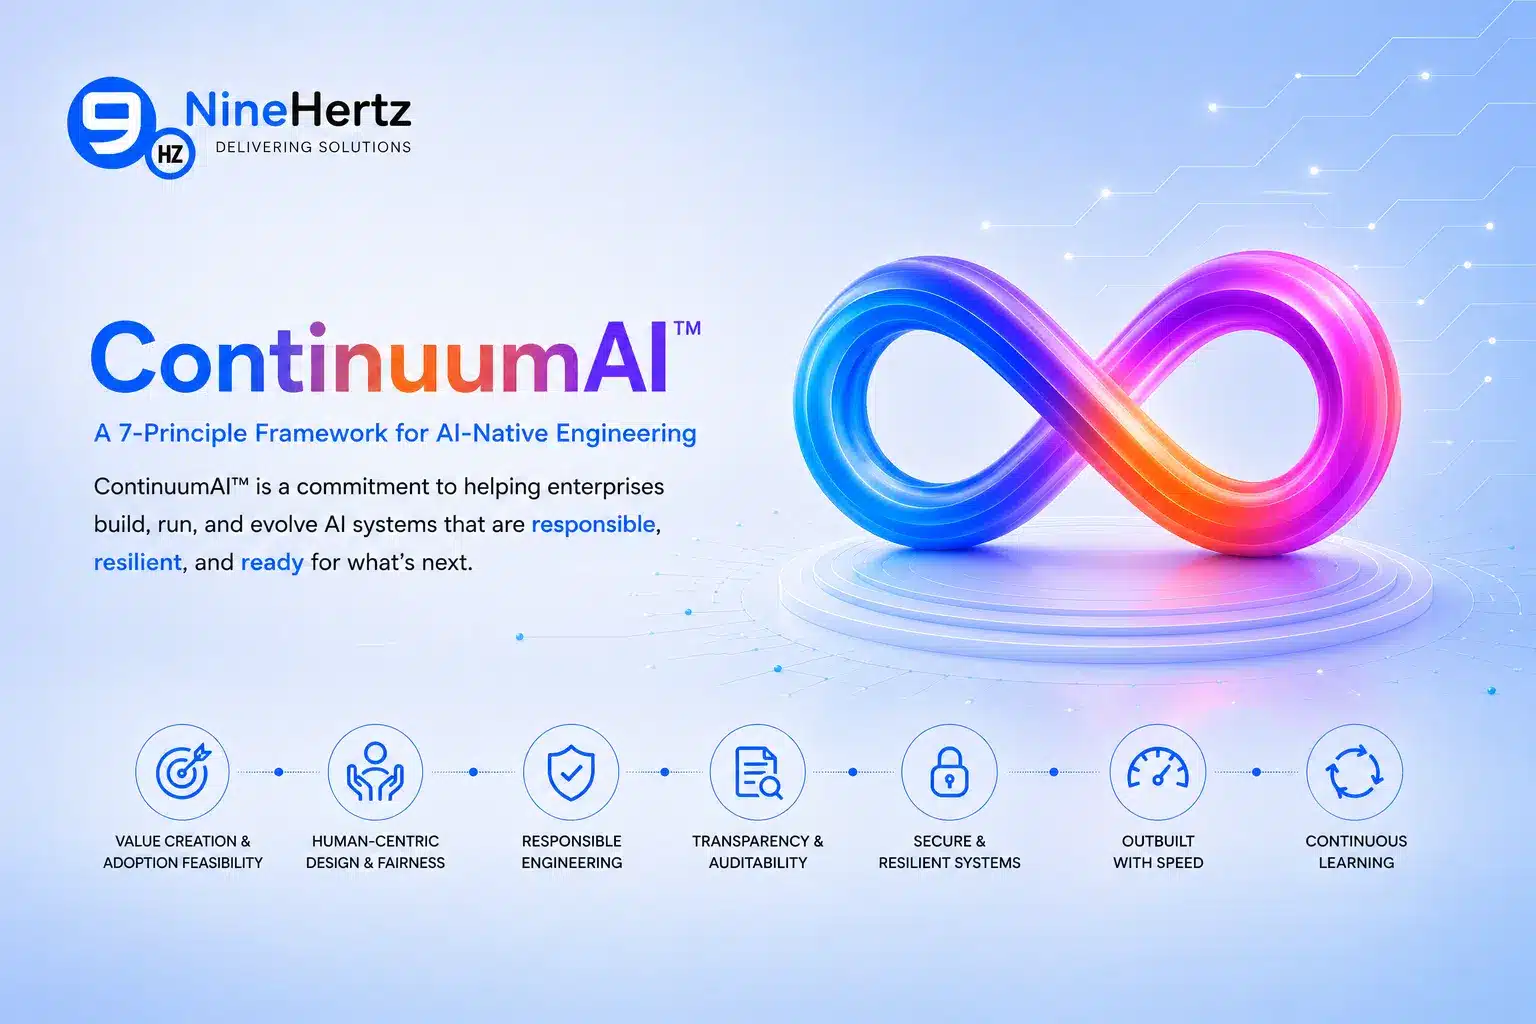
The NineHertz Introduces ContinuumAI™: A 7-Principle Framework for AI-Native Engineering that Helps Enterprises Build, Run, and Evolve
India June 18, 2026- The NineHertz, an AI-native engineering partner with more…

Build vs Buy vs Partner: How ISVs Decide on Engineering Capability
Key Takeaways Build vs Buy vs Partner; each serves a different business…

The NineHertz Marks World Blood Donor Day 2026 with In-House Blood Donation Camp
Jaipur, India — June 14, 2026 — The NineHertz set up a…

How AI Is Used in Manufacturing: 10 Use Cases to Know in 2026
AI use cases in manufacturing have transformed the way this industry operates…
The NineHertz Selected as the OpenGov 2026 Professional Services Partner of the Year
[CHICAGO, IL] — May 2026 — The NineHertz has been recognized as…