A CFO- and CTO-ready guide to what an India ODC really costs.
Every CFO and CTO evaluating an offshore development center (ODC) in India eventually asks the same question: what will this really cost, and when does it pay back? Rate cards rarely answer it. A low hourly rate can hide management overhead, knowledge-transfer time and attrition, while a slightly higher all-in rate can be the cheaper option once those costs are included.
The baseline you are comparing against is also rising. In the United States, the median annual wage for software developers was $135,980 in May 2025, and employment of software developers is projected to grow 10% from 2025 to 2035 (U.S. Bureau of Labor Statistics, Occupational Outlook Handbook). Cost is no longer the only reason companies go offshore either: Deloitte’s 2024 Global Outsourcing Survey reports that skilled talent and agility have joined cost reduction as key drivers for outsourcing (Deloitte, 2024 Global Outsourcing Survey).
This guide gives finance and technology leaders a complete way to plan offshore development center cost in India: the cost buckets that make up TCO, how a fully loaded rate is built, a three-year worked comparison with a sensitivity table, an ROI model, a phased budget plan and a checklist to take into vendor conversations.
There is no single price for an ODC, because cost depends on team size, seniority, technology stack, city, security requirements and the engagement model. What every estimate should share is the same structure:
ODC total cost of ownership = (Fully loaded cost per engineer-month × engineer-months) + one-time setup and transition costs + your internal oversight costs + risk reserves (attrition, rework, currency)
With a partner-run ODC, most of the first term is bundled into one all-in monthly rate per engineer. With a captive center or a build-operate-transfer (BOT) model, you carry each line yourself. Either way, insist on seeing every component, because the cheapest headline rate is often not the lowest TCO.
Use these eight buckets to compare offshore development center cost across proposals on a like-for-like basis.
| # | Cost bucket | What it includes | One-time or recurring | Usually inside a partner’s all-in rate? |
|---|---|---|---|---|
| 1 | People | Salaries, statutory benefits, insurance, bonuses, leave cover | Recurring | Yes |
| 2 | Workspace | Dedicated or secured bay, utilities, facilities, physical security | Recurring | Yes |
| 3 | Technology | Laptops, licenses, development tools, test devices, connectivity | Mostly recurring | Usually; confirm tool licenses |
| 4 | Delivery management | Delivery lead, scrum or project management, HR, finance, admin | Recurring | Yes in an ODC; you pay directly in a captive |
| 5 | Security and compliance | Access controls, audits, background checks, certifications, data protection | Both | Partly; client-specific audits are often extra |
| 6 | Recruitment and attrition | Hiring, onboarding, replacement hiring, knowledge loss | Both | In an ODC the partner carries replacement hiring |
| 7 | Transition | Knowledge transfer, documentation, travel, parallel running | One-time | No; budget it yourself |
| 8 | Your oversight | Product owner, architect and leadership time on your side | Recurring | No; this is your cost |

Buckets 7 and 8 are the ones most often missing from business cases, and they sit on your side of the ledger whichever model you choose.

A fully loaded rate is built in layers. Asking a vendor to walk you through each layer is the quickest way to judge whether a rate is realistic, and where the margin sits.
| Layer | What it adds | Question to ask the vendor |
|---|---|---|
| 1. Base salary | Market pay for the role, seniority and city | What experience band and city is this rate based on? |
| 2. Statutory benefits and insurance | Provident fund, gratuity, health insurance and leave as required by Indian law and policy | Are statutory contributions and leave cover included? |
| 3. Workspace and IT | Seat, connectivity, hardware, standard software | Is the bay dedicated and access-controlled for my team? |
| 4. Delivery management | Delivery lead, people management, HR and administration | What is the ratio of delivery management to engineers? |
| 5. Tools and security | Paid tools, security controls, audits, background checks | Which certifications and audits are included in the rate? |
| 6. Attrition reserve | Replacement hiring, overlap and knowledge retention | Who pays for replacement and handover when someone leaves? |
| 7. Partner margin | The provider’s profit and risk | Is pricing transparent per layer, or a single blended number? |
NineHertz perspective: When a rate is far below the market for a given seniority, one of the layers is usually missing, most often delivery management or an attrition reserve. Those costs do not disappear; they come back as slower delivery, churn or your own managers doing the work.
| Driver | Effect on cost | How to manage it |
|---|---|---|
| Seniority mix | The biggest single lever; senior architects and AI specialists cost significantly more | Set a pyramid by phase: senior-heavy at launch, broader mix at scale |
| Technology stack | Scarce skills (AI/ML, data platforms, cybersecurity, niche legacy stacks) carry a premium | Use specialists for design, generalists for build, and pair them |
| City tier | Tier-1 metros generally cost more and see more attrition than tier-2 cities | Consider tier-2 hubs for stable, long-term teams (see the tier-2 vs tier-1 comparison) |
| Team size | Fixed costs (delivery lead, security setup) spread across more engineers as you scale | Plan a ramp so per-engineer overhead falls over time |
| Time-zone overlap | Late shifts for US overlap add cost and affect retention | Agree a fixed overlap window (for example 3–4 hours) rather than full night shifts |
| Security and compliance | Dedicated bays, client-specific audits and regulated data add cost | Define controls by data sensitivity, not maximum controls everywhere |
| Engagement model | Augmentation, ODC, BOT and captive centers spread cost and risk differently | Match the model to how long you need the team and whether you want to own it |
| AI-augmented delivery | AI tools add license cost but can raise output per engineer | Measure output per engineer, not just cost per engineer |

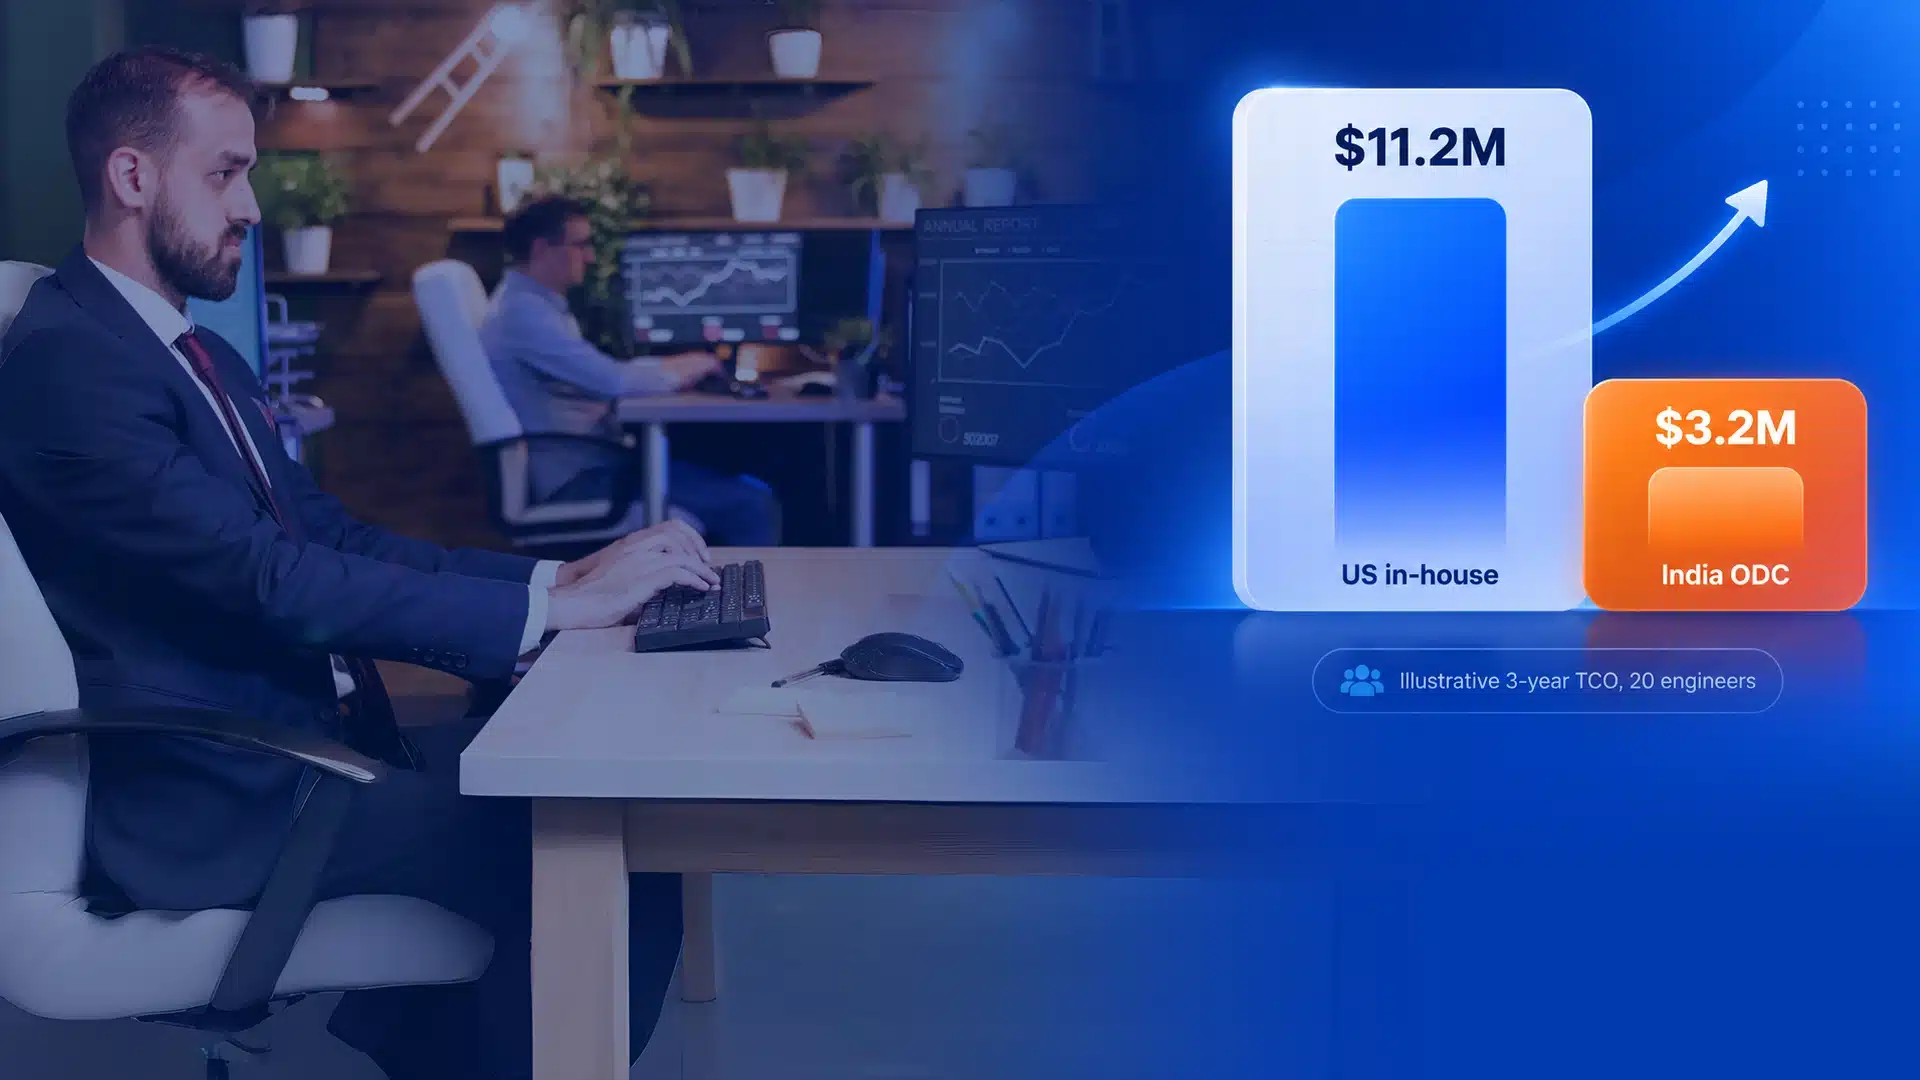
To make the economics concrete, here is an illustrative three-year comparison for a 20-engineer team. Every assumption is stated so you can replace it with your own numbers.
US baseline (sourced): median software developer wage of $135,980 (BLS, May 2025). Benefits make up 30.0% of total employer compensation costs for private industry workers (BLS, June 2026), so a fully loaded US cost is about $194,000 per engineer per year ($135,980 ÷ 0.70). We increase it by 3.3% a year, the growth in private-industry compensation costs from June 2025 to June 2026 (BLS, Employer Costs for Employee Compensation; BLS, The Economics Daily). This US figure excludes recruiting, office space, equipment and software, so it understates the real in-house cost.
ODC assumptions (illustrative, not a quote): an all-in partner rate of $4,000 per engineer-month covering buckets 1–6, rising 5% a year; a ramp from 8 to 14 to 20 engineers in year one (186 engineer-months), then 20 engineers (240 engineer-months a year); $60,000 of one-time transition cost; and half of a US manager’s loaded time for oversight every year.
| Year 1 | Year 2 | Year 3 | Three-year total | |
|---|---|---|---|---|
| US in-house, same capacity | $3.01M | $4.01M | $4.15M | $11.17M |
| India ODC (rate × engineer-months) | $0.74M | $1.01M | $1.06M | $2.81M |
| + Transition (one-time) | $0.06M | — | — | $0.06M |
| + Your oversight (0.5 FTE) | $0.10M | $0.10M | $0.10M | $0.30M |
| India ODC total | $0.90M | $1.11M | $1.16M | $3.17M |
| Difference | 70% lower | 72% lower | 72% lower | About $8.0M (72%) lower |

Rates differ by seniority and stack, and a new team rarely matches an established one in its first months. The table shows three-year savings against the same US baseline at different all-in rates, first at equal productivity and then if the ODC team needs 25% more engineer-months to deliver the same output (a productivity factor of 0.8).
| All-in ODC rate per engineer-month | Three-year ODC TCO (equal productivity) | Savings vs. US | Three-year ODC TCO (0.8 productivity) | Savings vs. US |
|---|---|---|---|---|
| $3,000 | $2.47M | 78% | $3.00M | 73% |
| $4,000 | $3.17M | 72% | $3.87M | 65% |
| $5,500 | $4.23M | 62% | $5.19M | 54% |
| $7,000 | $5.28M | 53% | $6.51M | 42% |
Illustrative model. Replace the rate, ramp, productivity factor and US baseline with your own figures; senior, AI-specialist or metro-based US teams cost more than the national median used here.
NineHertz perspective: The productivity factor matters more than a few hundred dollars of rate. A team with strong delivery leadership, documented knowledge transfer and a stable roster reaches full productivity faster, and that is worth paying for. Negotiate on outcomes and retention, not only on rate.
Get a role-by-role rate breakdown and three-year TCO for your team.

Savings are the easiest return to model, but they are rarely the only one. A complete ROI view includes the value of work you could not otherwise deliver, along with the wider benefits of an offshore development center such as faster scaling and access to specialist skills.
ODC ROI = (In-house cost avoided + value of additional capacity and speed − ODC total cost of ownership) ÷ ODC total cost of ownership Payback period = One-time setup and transition costs ÷ monthly net savings
In the worked example, the $60,000 transition cost is recovered within the first month of operation from cost avoidance alone. That is why payback is rarely the deciding question. The more important test is whether the team delivers at the quality and speed you need.

Track these measures from month one so the business case is proven, not assumed.
| Dimension | Metric | Why it matters |
|---|---|---|
| Cost | Fully loaded cost per engineer-month; cost per delivered feature or story | Shows real unit cost, including oversight |
| Speed | Cycle time from ticket to production; release frequency | Shows whether added capacity becomes faster delivery |
| Quality | Escaped defects, rework rate, incident count after release | Prevents savings being lost to rework |
| Stability | Attrition, average tenure, knowledge coverage per component | Protects continuity and ramp-up investment |
| Capability | New skills added (AI, data, cloud) and roadmap items unblocked | Captures value beyond cost |
| Governance | Security audit results, SLA adherence, IP and access compliance | Keeps risk visible to the board |

Budget an ODC as a ramp, not as a full team from day one; offshore development center cost should follow proven productivity. A phased plan lowers risk, lets you prove productivity before scaling and spreads one-time costs.
| Phase | Timing | Team size (share of target) | Main budget lines | Exit criteria before the next phase |
|---|---|---|---|---|
| 0. Plan and select | Weeks 0–4 | 0% | Vendor selection, security review, contracts, workspace setup | Signed SOW, security controls agreed, roles defined |
| 1. Core team | Months 1–3 | 30–40% | Senior engineers and delivery lead, knowledge transfer, travel | Stable velocity, documentation in place, first releases shipped |
| 2. Scale | Months 4–9 | 70–100% | Additional engineers, QA and DevOps roles, tools | Quality and cycle time at or above target |
| 3. Optimize | Months 10–24 | 100% | Steady-state rate, continuous improvement, AI tooling | Cost per output falling, attrition within agreed limits |
| 4. Own (optional) | Month 18+ | 100% | BOT transfer: entity, employment transfer, assets | Transfer plan approved, legal and tax advice obtained |
Hold a contingency of 5–10% of the annual budget for attrition backfill, extra overlap hours or scope changes, and review it every quarter.
Overruns in offshore development center cost often come from items no one budgeted:
| Hidden cost | Why it appears | How to contain it |
|---|---|---|
| Knowledge transfer | Your experts spend time onboarding the new team | Time-box it, record sessions and build a written knowledge base |
| Time-zone overlap | Synchronous meetings need shared hours | Agree a fixed overlap window and move status updates to async |
| Attrition | Leavers take knowledge with them and new joiners need ramp-up time | Contract for retention plans, backups and handover periods |
| Rework | Unclear requirements and weak acceptance criteria | Shared definition of done, automated tests and code review |
| Travel | Kick-offs, planning sessions and leadership visits | Plan two to three in-person sessions a year rather than ad hoc trips |
| Vendor lock-in | Code, tools or knowledge held by the provider | Keep code in your repositories, own documentation and include transition clauses |
| Compliance audits | Client-specific audits and certifications | Agree audit scope and costs in the contract |
| Currency movement | Contracts priced in INR or with adjustment clauses | Price in USD or agree a band for currency adjustment |
IP ownership deserves its own review; see how to protect IP in an offshore center.
Different engagement models spread offshore development center cost and risk in different ways.
| Model | Upfront cost | Ongoing cost profile | Who carries attrition and admin | Best fit |
|---|---|---|---|---|
| Team augmentation | Lowest | Per-role monthly rate; your managers lead | Provider replaces people; you manage the work | Short-term skills or capacity gaps |
| Partner-run ODC | Low | All-in monthly rate per engineer | Provider | Multi-year roadmaps without building an entity |
| Build-operate-transfer | Medium | Operate fee, then your own costs after transfer | Provider, then you | Long-term capability you want to own |
| Captive center | Highest | Full cost of entity, people and facilities | You | Large, permanent operations with in-house leadership |
For a side-by-side view of control, timelines and ownership, see how the engagement models compare.
Use this list to pressure-test any offshore development center cost estimate before you sign.
At The NineHertz, we model offshore development center cost with you before a team is hired. We share a transparent rate build-up by role, model three-year TCO against your current option, and design the ramp, seniority mix and governance that keep cost per output falling over time. Every engagement includes a delivery lead, agreed KPIs, security controls and code in your repositories, with AI-assisted engineering reviewed by senior engineers and governed by ContinuumAI™.
If you only need a few specialists, compare an ODC with adding specialists to your team, and read why Jaipur is a strong base for long-term offshore teams.
Share your roles and timeline, and we will map your three-year TCO.
It depends on team size, seniority, technology stack, city, security requirements and engagement model. Compare proposals on fully loaded cost per engineer-month plus transition, oversight and risk reserves, rather than on hourly rates. Ask each vendor for a role-by-role rate build-up from salary to the all-in rate.
Eight buckets: people, workspace, technology, delivery management, security and compliance, recruitment and attrition, transition (knowledge transfer and travel) and your own oversight time. Partner-run ODCs usually bundle the first six into an all-in monthly rate; transition and oversight are on your side.
Savings depend on the rate, seniority mix and productivity. In our illustrative 20-engineer model, an India ODC costs roughly 55% to 75% less than an equivalent US in-house team over three years after allowing for transition costs, oversight and a slower first-year ramp. Replace the assumptions with your own figures.
One-time setup and transition costs are usually recovered within the first months of operation from cost avoidance alone. The more important measure is whether the team reaches the quality and speed you need, so track cycle time, defects and attrition from month one.
Budget a ramp: a planning phase, a core team at 30 to 40 percent of target size for the first three months, scaling to full size by months four to nine, then optimizing. Hold a 5 to 10 percent contingency for attrition backfill, extra overlap hours or scope changes.
Knowledge transfer, time-zone overlap, attrition and ramp-up, rework, travel, vendor lock-in, client-specific compliance audits and currency movement. Each can be contained with contract terms, documentation, automation and a clear communication cadence.
A partner-run ODC has the lowest upfront cost because the provider carries the entity, facilities and administration. Build-operate-transfer adds transfer costs but gives you ownership later, and a captive center has the highest upfront cost and the most control. Choose based on how long you need the team and whether you want to own it.

Key Takeaways Jaipur delivers 35–45% lower operating costs than Bangalore, with attrition running 12–16% versus the 28–35% Tier-1 average and…

This is technology’s tipping point! The smart and future-forward organizations are not only slashing costs, but they are also building…

Key Takeaways IP architecture is not a legal formality bolted onto an India ODC after launch; it is a strategic…