Cloud Cost Optimization Framework: How FinOps Architecture Helps SaaS Teams Reduce Cloud Waste and Protect Engineering Velocity

- Due to ineffective architecture, ownership, and governance, the cloud setup can become up to 8x more expensive.
- Native cloud cost tools don’t always break down costs by feature, customer, team, or business value, except for the billing data.
- When cloud cost reaches nearly 30% of revenue, it becomes a unit economics issue, not just an engineering or finance concern.
- A Cloud FinOps Intelligence Architecture helps connect cloud usage with ownership, alerts, optimization, and governance.
- Valued at a $14.88 billion, the Cloud FinOps market is set to reach $26.91 billion by 2030 at a CAGR of 12.6%.
- For digital natives, cloud cost control is now part of product scalability, not only infrastructure management.
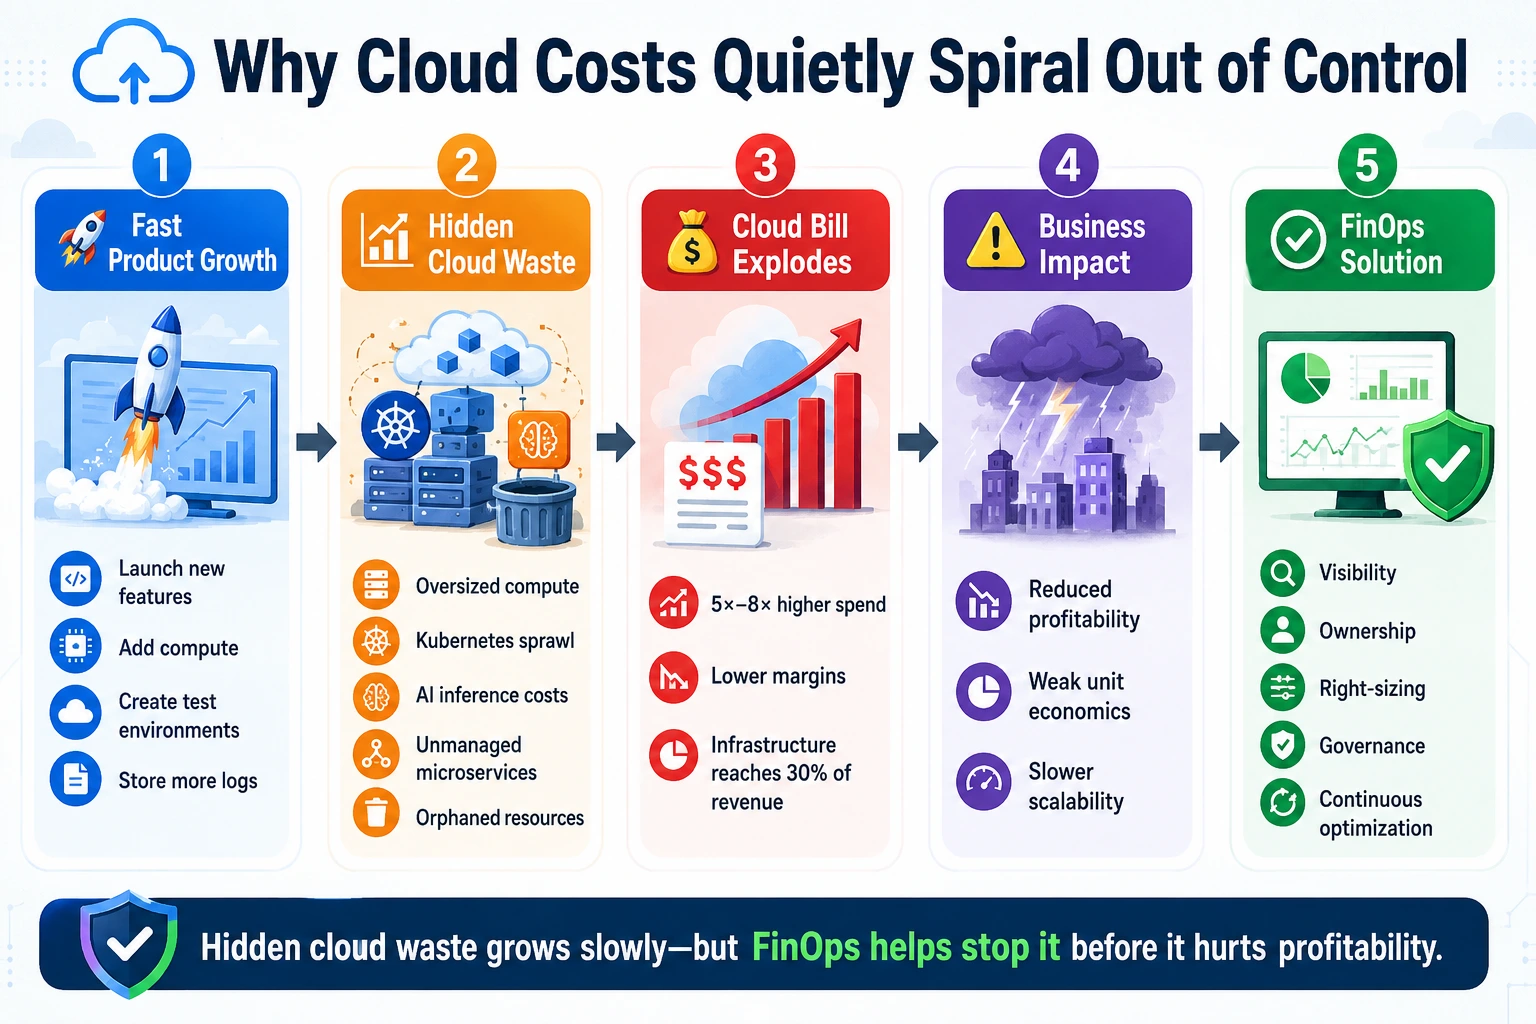
A cloud bill does not become a problem overnight. It usually grows slowly, one architecture decision at a time.
A team adds extra compute to avoid downtime. Another team keeps test environments running. Logs, backups, storage, AI requests, and data pipelines keep growing in the background. At first, the bill looks normal because the company is also growing. But after 12 to 18 months, the same cloud setup can become 5x or even 8x more expensive.
This is where many SaaS companies, AI platforms, marketplaces, and digital businesses face a difficult question: is the cloud bill growing because the business is scaling or because the architecture is carrying hidden waste?
Cloud cost is no longer only a financial issue. It is also an architecture, ownership, and governance issue. If teams cannot connect spend with products, features, customers, and revenue, cost control becomes guesswork.
This article explains why cloud bills grow so fast, where native cost tools fall short, and how Cloud FinOps Intelligence Architecture and a cloud cost optimization framework help businesses control cloud spend without slowing growth.
What Is a Cloud Cost Optimization Framework?
A cloud cost optimization framework is basically a repeatable and structured system of policies, processes, and software used by organizations to manage, reduce, and control their cloud spending. The framework focuses on centralizing the governance, monitoring, and technical practices to make continuous cost efficiency an embedded part of cloud operations.
This framework is part of the organization’s FinOps that relies on a three-phase lifecycle to ensure accurate cost predictability.
Inform (Visibility)
It includes ingesting the billing data across providers like Azure, AWS, and GCO to apply the resource tagging and attribute the expenses to specific teams. The goals of this phase are to bring cost awareness and transparency across the organization.
Optimize (Action)
Optimization mainly connects with rightsizing the infrastructure by either downscaling over-provisioned compute, storage resources, and network, or auto-scaling what is actively being used. The goal of this phase is to eliminate waste and identify the most effective pricing.
Operate (Governance)
The last stage of the lifecycle establishes the approval workflows and governance policies for new budget alerts and deployments. This phase dedicatedly brings cultural alignment between operations, engineering, and finance teams. The goals of this end phase are to align technical performance with business KPIs and budget.
Why Cloud Bills Grow 8x in 18 Months: The Architecture Decisions That Create Cost Explosions
Cloud bills often balloon by 8x in just 18 months due to unconstrained elasticity paired with decentralized engineering. What actually happens is:
At the early stage, teams focus on speed. They launch features, add environments, increase storage, collect more logs, and scale compute to stay safe. Each decision looks reasonable in that moment. But after 12 to 18 months, the company may look at the bill and ask, “How did it get this high?”
Ready to Reduce Cloud Waste Without Slowing Innovation?
The Architecture Decisions That Fuel Cost Explosions
- The Data Gravity Trap
- Kubernetes and Container Sprawl
- Unmetered AI Workloads
- Unmanaged Microservices
- Orphaned Resources
Processing massive amounts of data across different tiers or geographies severely spikes costs. The data may look cheap at first, but the services around it make the real cost much higher. Eg, moving 1 terabyte of data between Amazon S3 and Google Cloud or across availability zones creates high egress and networking.
Kubernetes gives teams flexibility but also hides wastage stats. Too many clusters, oversized pods, poor resource limits, and always-running workloads can quietly increase compute cost. If no one reviews usage, container platforms become expensive very quickly.
AI features can create sudden cost pressure. Every prompt, image, search query, recommendation, or model call may carry compute or API cost. Without usage limits, caching, or request-level tracking, AI workloads can grow faster than expected.
Microservices help teams build faster, but each service also brings its own compute, storage, logs, monitoring, and network costs. When services are created without lifecycle reviews, the platform becomes harder and more expensive to run.
Old test servers, unused volumes, stale snapshots, idle load balancers, and forgotten public IPs often stay active long after the project ends. These small resources may look harmless, but across teams and months, they create steady waste.
Outcome : Cost explosion is not just a billing problem; these are architectural and ownership faults that may stay invisible for too long.
The Unit Economics Crisis: When Infrastructure Cost Reaches 30% of Revenue
It’s true that when the raw cloud bill alone climbs to 30% of total revenue, then a SaaS or digital business crosses a critical unit economics crisis threshold. A high cloud bill is not the real problem; it starts when a cloud cost grows faster than revenue. Although growth still looks on revenue, margin quality is weak and scaling may amplify losses.
What does the 30% Threshold Mean?
When infrastructure cost takes a large share of revenue, it signals that growth is becoming expensive. The company may still be adding customers, transactions, data, and product usage. But if every new customer also adds heavy compute, storage, database, or AI costs, the margin starts getting weaker. This is where cloud cost becomes a unit economics issue, not only an engineering issue.
Why does the unit economic crisis happen?
The unit economic crisis happens when teams track the total cloud bill but not the cost behind each business unit.
A product might have costly features like AI requests, analytics, video processing, search, or reporting. Some major customers may use more resources than you anticipated, but the number of such customers is small. Some workloads may run all the time, even when usage is low. Without unit-level tracking, these costs stay hidden inside the total bill.
What Measures Teams Need to Take
- The first critical step is to connect cloud cost with product usage and revenue.
- Measure cost per customer, cost per query, or cost per workflow instead of only team-level cloud spend.
- Implement tagging and allocations so cost can be tied to products and customers.
- Review expensive product flows, i.e., AI features, reporting, search, analytics, and data-heavy workflows.
- Compare infrastructure cost with pricing and revenue to check whether the business model still works at scale.
Thus, when cloud cost reaches 30% of revenue, the answer is not always to buy cheaper cloud capacity. The better question is: why does the architecture need this much cost to serve the customer?
What Your Cloud Provider’s Cost Explorer Is Not Telling You?
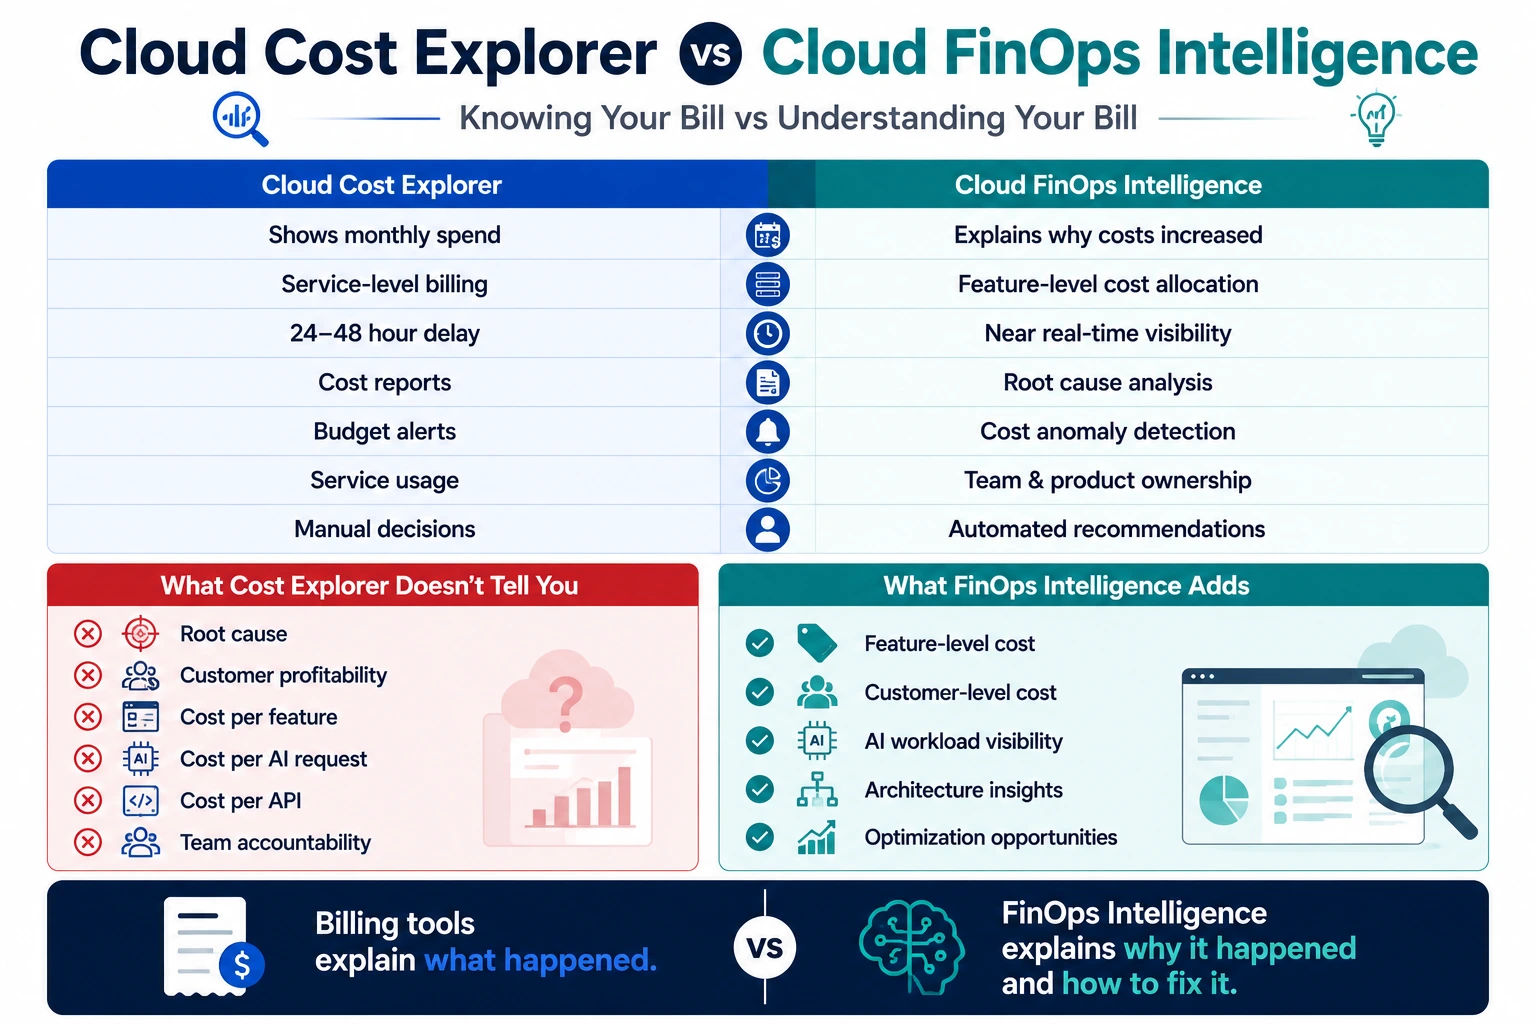
Cloud vendors already provide native cloud cost tools such as AWS Cost Explorer, AWS Budgets, or Google Cloud Billing Reports. They are integrated into vendors’ billing systems and show monthly spend, service-wise usage, budget alerts, and basic forecasts. These tools only tell what you spend, but obscure the root cause of costs.
They do not reveal, “Which product, feature, team, or customer is creating this cost?” Here is what Cost Explorer is not telling you:
No Root Cause
A cost explorer may show that the database cost spiked last week. It may not show the real reason, such as unindexed queries, chatty microservices, or cross-region traffic creating network fees. It shows the financial symptom, not the architecture issue.
The 24-to-48 Hours Blindspot
The lag in data updates is a critical issue. Most cost explorers can have a delay of 24-48 hours, and the information becomes outdated. It hinders timely decision-making and prevents finance teams from addressing cost spikes promptly.
The “EC2-Other” Black Box
Especially if you use AWS, one of the largest items on your bill is often categorized as “EC2-Other” or “Uncategorized Shared Costs.” It won’t tell about a misconfigured NAT gateway, can’t split the cost of a shared Kubernetes cluster, and others.
Missing Business Context
Provider tools show services, accounts, regions, and resources. Business leaders need one more layer: which feature, customer, team, product line, or environment created the spend. Without that context, nobody gets the full cost story.
The Scale to Infinity Trap
Most cost explorer tools advise about right-sizing, reserved capacity, or unused resource cleanup. Although these suggestions may be useful in some conditions, they should not be applied blindly, as they can crash a production application.
Therefore, using FinOps intelligence is a better option, as it explains the reason behind the bill, where cost explorer only shows the bill.
Turn Your Cloud Spend Into a Competitive Advantage
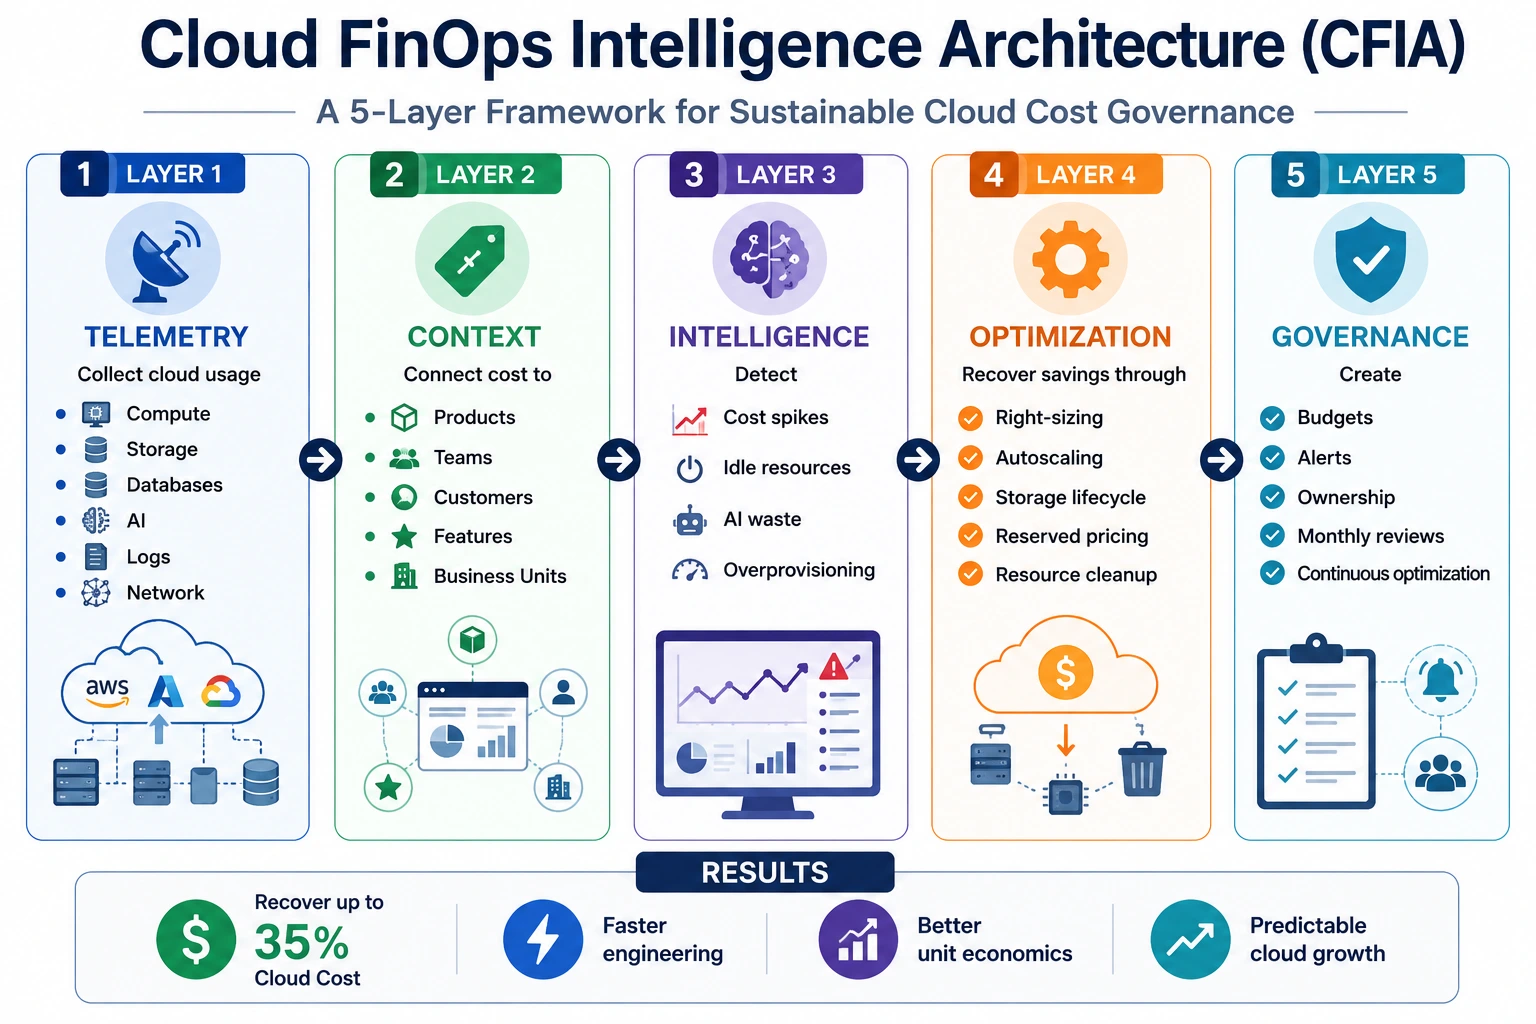
Building a Cloud Cost Optimization Framework with CFIA: Five Layers of Cost Governance
Cloud problems start with the finance team, but that’s not true; the problem starts inside the architecture. The design decision impacts the cloud bills prior to when finance sees the invoice. A cache miss, a region choice, or a serverless function, anything can be a bill.
To simplify the cost challenges at the source, fine engineering and a structured framework are required. Thus, it would be good if it were in layers of cost governance in the form of a cloud cost optimization framework with CFIA, aka Cloud FinOps Intelligence Architecture, as follows:
The Telemetry Layer
The objective of the telemetry layer is to clean and standardize the data to prevent the cloud saving discussion from being guesswork. It collects cloud usage and billing data from diverse sources such as compute, storage, databases, data transfer, logs, AI workloads, and third-party services. Every Cloud Cost Optimization Framework begins with accurate telemetry
The Context Layer
Cloud cost should be mapped to how the business actually works. That means connecting spend with teams, products, features, customers, environments, and business units. The question changes from “Why is the cloud bill high?” to “Which part of the business is creating this cost?”
The Intelligence Layer
Call the intelligence layer the central nervous system that processes everything. Before cost problems occur after the arrival of the bill and the damage is done, the cost intelligence layer helps teams catch the issue early. This layer catches unexpected cost spikes, idle resources, overused services, and others using metrics such as cost per active user, cost per transaction, CPU memory utilization, and strategy metrics.
The Optimization Layer
The optimization layer is the execution engine of a cloud cost optimization framework. At this layer, the transition is real, and the architecture moves from passive observation to active cost governance and guardrails. If the intelligence layer is the nervous system, then this layer acts as a muscle. It shows ways from where savings can come from, such as right-sizing compute, shutting down unused resources, improving autoscaling, and redesigning expensive workflows.
The Governance Layer
It is a critical and final layer of the CFIA architecture that makes cloud cost control repeatable in FinOps. The governance layer includes budgets, alerts, approval rules, ownership choices, saving reports, and monthly reviews. You can also call it a decision intelligence layer where cost governance becomes continuous management.
Right-Sizing Architecture: Recovering Cost from Overprovisioned Compute
Expert analysis indicates that right-sizing overprovisioned commutes can help recover 20%-40% of the cloud spend. It also tackles the issue of over-provisioning. It is the process of actively adjusting resource capacities to meet the actual demand.
What actually happens is – A team chooses a larger server to avoid performance issues. Another team keeps extra capacity ready for traffic spikes. A database gets more memory than it normally uses. At first, these choices look practical. But when the same pattern spreads across hundreds of workloads, the monthly cloud bill starts growing. Without a well-defined cloud cost optimization framework, these small decisions quietly add up to significant infrastructure costs that reduce profitability over time.
Applying the right-sizing process in a phased approach, the cost can be recovered from overprovisioned compute.
- Reclaim Idle Resources
Identify “zombie” (instances that are no longer in use) assets. Before termination, check who owns it, the impact of termination, and whether it is difficult to re-create the instance if it needs to be restored later. Also, spruce up orphaned volumes, unattached snapshots, idle load balancers, and unused public IPs.
- Analyze Real Consumption Data
The best approach is to analyze real consumption data based on CPU utilization, memory consumption, disk IOPS, and network throughput. This will eliminate the guesswork. For better results, you can also use tools like AWS Compute Optimizer or Google Cloud Recommender to establish a steady-state consumption baseline.
- Downsize & Optimize Instances
Once usage patterns are clear, teams can move oversized workloads to smaller instances. Shrinking oversized systems, switching to a smaller server, matching business needs with accuracy, and stopping overpaying for capacity will help cut bills effectively.
- Architect Flexible Systems
Another best practice for right-sizing is architecting flexible systems that can automatically scale, grow, or shrink according to the needs, and pay only for traffic(for exact minutes servers are working for customers).
- Align Pricing Models
After right-sizing the workload, review pricing models. It works like, stable workloads may fit reserved pricing or savings plans, while flexible workloads may use on-demand or spot options.
Architecture-Level Cost Reduction: The Savings That Survive Traffic Growth
Right-sizing helps recover waste from existing resources. But it is not enough when the product, users, and data continue to grow. After a certain point, cloud savings must come from the way the system is designed.
This is where architecture-level cost reduction matters. Instead of just reducing resource sizes, it targets changes to the platform’s cost behavior.
For example, if every user request directly hits the database, the cost will rise with traffic. Caching of a system, queues, and better data flow can handle more users without increasing the cost.
Simply, using proactive resource resizing and cost-aware design engineering teams can deliver compound savings and empower FinOPs frameworks.
Here are some key strategies for architectural scaling, and the fundamental one is to build elasticity into foundational design.
Event-Driven & Serverless
Eliminate idle resource waste during peak hours by moving to serverless patterns, which automatically handle traffic growth and only pay for exact execution time.
Intelligent Caching
Intelligent Caching combines a CDN with Edge Caching to serve static assets right to the users. This reduces load on the origin compute, reduces the number of API requests, and reduces the cost of cross-region data transfer.
Horizontal Autoscaling
Horizontal scaling adds or removes computing power based on real-time demand and prevents expensive servers from running all the time. It works in two ways, i.e., Reactive and Predictive. Reactive scaling directly responds to current load when web traffic or CPU usage spikes and adds more containers.
Predictive scaling uses machine learning to analyze historical data and launch extra containers even before the chances of server rush. Thus, it saves costs like wasted resources.
Traffic Routing & Multi-AZ
It refers to interconnecting cloud components physically close to one another to avoid expensive network fees. AZ is Availability zones(single region divided into multiple physical data centers). Keeping systems in diverse AZs protects against data center outages. By keeping data transit local and private, the enterprises can eliminate the hidden cloud courier fee.
Building the FinOps Dashboard: Real-Time Cost Visibility by Team and Feature
Visibility is a critical component of any cloud cost optimization framework. Creating a FinOps dashboard requires a shift from raw cloud billing data to team and feature-level cost allocation. It should not be only a billing screen. If it only shows total cloud spend, service-wise cost, and monthly trends, it may help finance, but it will not help teams make better decisions.
A useful FinOps dashboard works like a cloud cost command center, streams data in near-real-time, and breaks down costs by team (who is spending it) and feature (business value it creates). This helps teams to understand their true cloud economics in real-time.
Show Cost By Team and Owner
The prime task of the FinOps visibility layer is to remove confusion around ownership. The better way to map the cloud cost is to map it to teams, business units, environments, and applications.
Example:
- For engineers and developers, it must focus on daily burn rates, cost per deployment, and anomalies.
- For product manages it should display unit economics, i.e., cost per user, cost per API call, to measure feature profitability.
- The finance team should know whether the increase is linked to real business growth or hidden waste.
With the clear ownership, cost conversations become faster, and the team would be able to know “what should we change?”
Track Cost by Feature and Usage
A company should know whether a feature is creating value or quietly increasing infrastructure cost. Without feature-level tracking, costs from search, reporting, API calls, AI requests, and other product flows stay buried inside the total bill. With this view, teams can measure cost per user, cost per transaction, cost per report, or cost per AI request.
Make Every Alert Accountable
A FinOps operational command centre should not only show numbers, but it should also help the team act with transparent ownership. Certain useful alerts can be sudden cost spikes, idle resources, budget overruns, poor tagging, unusual data transfer, or workloads growing faster than revenue. Each alert should have a priority, an owner, a possible cause, and a next step.
With this setup, FinOps moves from monthly reporting to daily cost control. The business does not wait for the bill to arrive. Teams see cost signals while the system is running and fix waste before it becomes a margin problem.
The Build sequence
- Start with mandatory tagging and owner mapping for accounts, projects, services, and features.
- Build the features for executive, finance, and engineering views separately, then connect them through the same data model.
- Add unit metrics for the top product flows first, since feature-level attribution is hardest there.
- Layer in alerts, anomaly detection, and action links once the baseline data is trustworthy.
Why Every SaaS Business Needs a Cloud Cost Optimization Framework
Let’s look at the financial blueprint for a digital-native company spending $120,000 per month ($1.44M annually) on cloud infrastructure and how an engineering-led FinOps strategy systematically recovers $504,000 every single year.
The anatomical breakdown of $120K/month is like:
- Compute & AI Inference (45%)
- Managed Data & Storage (25%)
- Data Transfer & Egress (10%)
- “Orphaned” & Zombie Resources (10%)
- Shared Infra & Platform Overheads (10%)
On an annual level, it will be of $1.44 million, and if it grows without cost ownership, the business may face pressure in three areas:
- Lower product margins
- Higher operating cost
- Slower path to profitability
This is why FinOps should be part of financial planning and architecture governance.
The Saving Calculation
If a company reduces 35% waste from a $120,000 monthly cloud bill, the annual savings can reach $504,000.
Formula:
- Annual Cloud Spend = Monthly Cloud Bill × 12
- Annual Saving = Annual Cloud Spend × Saving Percentage
- Monthly cloud bill: $120,000
- Annual cloud spend: $1,440,000
- Target saving: 35%
- Annual saving: $504,000
- Remaining annual cloud spend: $1,440,000 – $504,000 = $936,000
This saving does not come from one action. It may come from right-sizing, idle resource cleanup, storage lifecycle policies, better pricing models, workload redesign, and stronger cost allocation.
Build a Cloud Architecture That Scales Revenue
Conclusion
Cloud cost does not rise only because a business is growing. It also rises when architecture, ownership, and governance do not grow with it.
Oversized compute, unmanaged data, unclear ownership, shared cost pools, AI workloads, and orphaned resources can quietly increase spend month after month. That’s why businesses need a cloud cost optimization framework with a FinOps intelligence layer that connects cloud usage with teams, features, customers, revenue, and business value.
The goal is not to cut cloud costs blindly. The goal is to remove waste, protect performance, and build a platform where infrastructure cost grows more slowly than traffic and revenue.
The NineHertz helps SaaS companies, AI platforms, and digital businesses build, run, and evolve cloud architectures with stronger visibility, cost governance, and scalability. With the right FinOps intelligence layer, cloud spend becomes easier to control before it starts affecting margins.
FAQs
What is FinOps architecture, and how does it reduce infrastructure cost?
Derived from finance and DevOps, it is an operational framework that brings financial accountability to cloud infrastructure management. It reduces infrastructure cost by finding waste, improving resource allocation, and helping teams act before spending affects margins.
How can digital natives cut cloud costs without slowing engineering velocity?
Digital natives can cut cloud costs by using right-sizing, autoscaling, tagging, cost alerts, storage lifecycle policies, and feature-level cost tracking.
Why does cloud infrastructure cost grow faster than user growth in SaaS companies?
When new users contribute computing, storage, logs, database load, API calls, or AI demands, cloud infrastructure costs rise more quickly. Poor architecture, unmanaged environments, and ambiguous ownership widen the gap.
What is a realistic cloud cost reduction from implementing FinOps?
A realistic cloud cost reduction from implementing FinOPs is typically 20%-30% within the first six months. It will be seven-figure annual savings for large-scale enterprises.
Great Together!
Latest Blogs

Build vs Buy vs Partner: How ISVs Decide on Engineering Capability
Key Takeaways Build vs Buy vs Partner; each serves a different business need for ISVs. Choosing the wrong one at…

How Engineering Velocity Helps ISVs Deliver Product Roadmaps on Time with Product Engineering Partners
Key Takeaways Engineering velocity is basically the key measurement of how fast a firm converts prioritized deliverables into working software…

How SaaS Companies Escape Architectural Debt Without Stopping Product Delivery: The Strangler Fig Modernization Method
Key Takeaways Architectural debt compounds silently — when one feature change touches three or more modules, hiring more engineers won't…