Logistics Analytics Dashboard: Features, KPIs, Benefits & Real-World Examples

- The logistics analytics dashboard can transform raw data into actionable insights, so that businesses can keep tabs on activities in real time
- Logistics analytics are becoming more widely adopted, and the global logistics analytics market is expected to grow from $9.4 trillion in 2024 to $23 trillion by 2035.
- By monitoring the right KPIs, operations can be improved, and businesses can achieve a balance between delivery speed, cost efficiency, and customer satisfaction through measurable data.
- The customized dashboards for logistics analytics solutions allow all teams to see what they need to know for transportation, warehousing, and inventory, and are an enabler of smarter collaboration.
- Business owners who use analytics-driven logistics platforms are competitively positioned to reduce costs, improve delivery reliability, and strengthen supply chains
Todays, Logistics depends as much on data as trucks and warehouses. Each shipment, delivery, and delay generates information, and companies that use this data make quicker and more intelligent decisions.
For this reason, modern logistics teams need a “Logistics Analytics Dashboard”.
Teamwork can go from one spreadsheet to another from the same platform. Dashboards can then be used to communicate operational information in a visual and intuitive way, enabling managers to easily monitor performance, correct mistakes and correct errors.
The demand for logistics analytics are increasingly needed.
Did you know?
The global logistics analytics market is expected to grow from $9.4 trillion in 2024 to $23 trillion by 2035, underscoring the strong investment in data-driven decision-making.
Customized dashboards for logistics analytics solutions help companies increase routes, cut costs, and improve real-time delivery.
In this post, we will present the major features, important KPIs, benefits, and examples of logistics analytics dashboards in action across modern supply chains.
What is a Logistics Analytics Dashboard
The Logistics Analytics Dashboard is a single, online tool that enables the analysis and presentation of logistics information in a clear, well-organized format. Logistics teams can view the shipment, inventory, transportation, and warehouse activities from a single screen, without having to skim through reports or switch between systems. It converts raw data to simple charts, graphs, and real-time metrics for transportation management systems (TMS), warehouse management systems (WMS), GPS tracking tools, and ERP platforms.
In other words, it allows teams to see what is happening at any given moment in the supply chain and act faster. Managers can see performance measures, anticipate delays, plan routes, and make informed decisions based on data without guessing. These customized dashboards for logistics analytics solutions are also programmable for different departments, from operations to executives, to focus on the important things for them, thereby making logistics activities more efficient, transparent, and proactive. That’s the reason businesses are looking for a trusted supply chain software development company to build dedicated software for seamless business operations.
Key Features of a Logistics Analytics Dashboard

A well-designed logistics analytics dashboard allows logistics departments to simplify complicated operations and make better, more informed decisions based on data.
1. Real-Time Data Visualization
Live dashboards show a detailed view of shipment, fleet and warehouse movements.
2. Dashboard Views with Customisable Options
Customize dashboards so that each team can focus on what they value most.
3. Monitoring KPIs
Convey key logistics performance indicators, such as on-time delivery, costs, and order accuracy.
4. Automated Alerts & Notifications
Get an instant response when anything goes wrong, or goes wrong, including performance.
5. Predictive Analytics
Historical data is utilized to predict demand, risk factors, and various business environments.
6. Route Optimization Insights
Plan routes for delivery with less fuel and travel costs.
7. Inventory Visibility
Gain real-time visibility into stock levels in warehouses and distribution centers.
8. Cost Analysis & Spend Tracking
Identify major cost drivers and control transportation and operational expenses.
9. Integrated Reporting
Automatically generate and share reports for quick and better decision-making.
10. Data Integration Capabilities
Connect seamlessly to TMS, WMS, and ERP systems to have integrated logistics information.
Core KPIs Tracked in a Logistics Analytics Dashboard
Logistics Analytics Dashboard is a user-friendly dashboard with metrics that provide insights into the performance of a logistics company. Organizations do not speculate but rather seek out specific KPIs that evaluate the efficacy of deliveries, operational expenses, utilization of assets, and the quality of customer service. These metrics comprehensively address all facets of logistics performance across transportation, storage, and stock management.
This parallel monitoring of these various KPIs allows quick identification of strengths, weaknesses, and opportunities for improvement. This comparison can easily be done on one dashboard and therefore can be used to compare speed, cost, and service quality while optimising overall supply chain performance.
| KPIs | Primary Focus Area | Operational Goal | Measured Frequency | Helps Improve |
|---|---|---|---|---|
| On-Time Delivery Rate | Delivery Performance | Ensure timely shipments | Real-time / Daily | Customer satisfaction & reliability |
| Transportation Cost per Shipment | Cost Management | Reduce shipping expenses | Weekly / Monthly | Profitability & budget control |
| Order Accuracy Rate | Warehouse Operations | Minimize fulfillment errors | Daily | Order quality & customer experience |
| Inventory Turnover Ratio | Inventory Management | Optimize stock movement | Monthly | Inventory efficiency & cash flow |
| Fleet Utilization | Asset Management | Maximize vehicle usage | Daily / Weekly | Resource productivity |
| Average Delivery Time | Operational Speed | Shorten delivery cycles | Real-time | Service efficiency |
How AI is Transforming Logistics Analytics Dashboards
The advent of AI is changing the way logistics companies see data, make informed decisions and improve operations. The traditional logistics dashboards were often about historical data, but artificial intelligence-powered customized dashboards for logistics analytics solutions provide predictive insights, automation, and real-time intelligence that help businesses better react to changing supply chain conditions.
By 2026, AI will become the most complex technology in logistics networks, allowing for increased efficiency, cost reduction, and visibility.
Real-Time Predictive Insights
AI assists logistics dashboards to move away from static reports and analyze data from shipments, vehicles, warehouses, and other variables, including weather or traffic. Machine learning models find patterns so that they can predict delivery delays, demand changes, or route teeters before they occur. This enables logistics managers to act rather than respond to problems.
Smarter Route Optimization
Intelligent algorithms run routes on real-time metrics such as fuel consumption, congestion, delivery priority, and driver availability. Dashboards can be used to automatically suggest routes that will reduce transit time and operation cost relative to an endless road plan. Business owners also benefit from improved delivery and lower transport costs.
Build Your Logistics Analytics Dashboard
Talk to our Experts
Talk to Our Logistics Experts
Automated Decision-Making
Modern logistics data analytics platforms with customizable dashboards take on specialized operational decisions. automated systems, for example, can automatically assign shipments, rebalance the inventory across warehouses, or notify the system when performance indicators fall below targets. Automation also eliminates manual intervention, so that the teams can focus on strategic planning rather than continuously monitoring.
Advanced Demand Forecasting
AI can learn about past shipments, seasonality, and market conditions for better demand prediction. Logistics dashboards can be used to show businesses these forecasts visually, and thus, businesses can better plan for levels of stocks, staff positions, and warehouse space. Forecasting for accuracy can help to avoid stockouts, overstocking, and last-minute logistics costs.
Intelligent Anomaly Detection
The AI uses the data about logistics to predict issues such as unexpected shipping delays, inventory changes, or price surges. Managers receive alerts not to the manually gathered reports, but to actionable insights that can expedite issue resolution and improve operational efficiency.
Enhanced Data Visualization and Insights
AI dashboards make it easy to break down complex data into digestible visuals. NLP enables users to type in queries like, “Which routes caused the highest delays this week?” and receive immediate summaries of the analytics. This provides logistics intelligence even to non-technical stakeholders.
Continuous Learning and Optimization
Unlike other types of data, these logistics data analytics platforms with customizable dashboards are time-varying. More data sets represent better predictions and recommendations for machine learning models. It is through this learning that logistics companies can quickly respond to changing customer needs, market conditions, and supply chain disruptions.
AI-Powered Predictive Insights for Proactive Decision-Making

Modern logistics no longer looks at the past, but predicts what will happen next. AI predicts how a user will employ the logistics analytics dashboard to make a decision. Through data collection, AI can anticipate disruptions before they affect operations by understanding historical data, real-time inputs, weather conditions, traffic information, and demand trends.
AI models can, for example, predict delivery delays, surges in demand, routes and shortages in inventory. It allows managers to improve transportation, use resources efficiently, and provide services in a potentially unpredictable world. It provides a means for organizations to reduce operational risk and to ensure reliable delivery and customer satisfaction.
Custom dashboards for logistics analytics solutions are also learning from new data, eventually being smarter, enabling better prediction and offering better recommendations. With automated data collection, firms can identify cost-saving opportunities, increase fleet utilization, and enhance capacity in ways that may not be discernible to humans. The omnipresent nature of predictive intelligence embedded in dashboards is helping logistics organizations to move from reactive problem-solving to data-driven, proactive decision-making.
Real-World Examples of Logistics Analytics Dashboard in Action
The most useful Logistics Analytics Dashboard happens when businesses use it to solve real-world operational problems. Analytics dashboards are used to improve visibility, cut costs, and deliverability across industries.
1. E-commerce Companies Optimizing Last-Mile Delivery
Dashboards provide information about delivery locations, driver behavior and order volumes for major online retailers.. They modify traffic and accelerate deliveries, adjusting last-mile routes. This capability also allows them to maintain strict delivery schedules and minimize fuel and operating costs.
For example, Amazon uses logistics analytics dashboards to monitor and control its network of delivery in real time, improving the performance of last-mile deliveries.
2. Retail Chains Improving Inventory Management
Retailers visualize warehouse and sales information in logistics reports that view inventory movement across sites. They can use this predictive information to accurately forecast demand, preventing both stockouts and overstock situations, thus ensuring product availability while minimizing storage costs.
Walmart is one of the largest retailers that tracks inventory levels across its stores and distribution centers using supply chain dashboards powered by analytics.
3. Third-Party Logistics (3PL) Providers Enhancing Client Visibility
These logistics data analytics platforms, including custom dashboards, allow 3PL firms to analyze real-time data regarding the status and performance of their clients. Customers can change delivery status, transit time and service levels, among other performance indicators, to gain more information and remain connected with customers.
DHL, the world’s largest logistics provider, offers analytics dashboards that help customers to see their shipments and performance and make informed logistics decisions..
4. Manufacturing Companies Streamlining Supply Chains
Logistics dashboards are used by manufacturers to track both the inbound and outbound shipments. They can spot bottlenecks early to delay production and help smooth supply chain operations.
Automobile manufacturer Toyota utilizes data analytics in its supply chain system to oversee supplier deliveries and production logistics, aiding its just-in-time manufacturing process.
5. Fleet-Based Logistics Companies Reducing Operational Costs
Operators, such as those running transportation services, view analytics dashboards detailing vehicle usage, fuel consumption, and driver performance. From this information, they derive insights on route planning, maintenance scheduling, and optimizing fleet utilization.
Companies like FedEx use logistics analytics platforms to examine their fleet data and improve delivery operations, which helps in reducing operational costs while maintaining reliable delivery services.
Business Benefits of Implementing a logistics data analytics platform with customizable dashboards

Logistics data analytics platforms can be configured to match the business needs without requiring manual reporting and manual decision-making. These platforms use operational data to provide visibility, allowing teams to make quicker, more informed decisions that enhance efficiency and profitability.
Improved Operational Visibility & Faster Decision-Making
- Transmit orders, inventory, and warehouse performance in real time.
- Identify bottlenecks and disruptions before they worsen.
- Stream together information from multiple logistics systems in one dashboard.
- Make informed, efficient operational decisions.
Cost Optimization and Resource Efficiency
- Route optimization reduces transportation and fuel costs, reducing transportation and fuel costs.
- Improve utilization of fleets and assets.
- Minimize inventory and storage costs.
- One function of performance analytics is to identify inefficiencies.
Build Your Logistics Analytics Dashboard
Talk to our Experts
Talk to Our Logistics Experts
Enhanced Customer Experience
Custom dashboards for logistics analytics solutions help to increase delivery accuracy and transparency, and improve customer experience. Teams can also see performance of services, set regular delivery dates, and keep their customers informed in real time. This establishes trust, reduces complaints and increases customer satisfaction.
Custom vs Off-the-Shelf Logistics Analytics Dashboard – Which One is Right?
One of the most significant decisions businesses make when investing in logistics technology is whether to invest in a custom-built dashboard for logistics analytics or a used dashboard from ad agencies. Both have attractive benefits but are dependent on the complexity of operations, budget, scalability requirements, and long-term business goals. Understanding these differences can assist the organization in selecting the best solution at least in terms of value, without unnecessary costs or limitations.
What Is a Custom Logistics Analytics Dashboard?
Custom logistic analytics dashboard is designed to meet your business processes, workflows and data requirements. The developers build the platform from scratch or assemble it further to your logistics needs.
Best suited for:
- Complicated supply chains for businesses.
- Businesses with multiple systems or older software.
- Companies need advanced analytics or AI integration.
- Helpful to organizations with very specific KPIs and reporting needs.
Advantages:
- Customizable features and dashboards.
- Integration with existing systems (ERP, WMS, TMS) is seamless.
- Greater flexibility as business grows.
- More control over data and more flexibility in security settings.
Challenges:
- A higher upfront development cost.
- Better timeframe for implementation.
- This requires regular maintenance and repair.
What Is an Off-the-Shelf Logistics Analytics Dashboard?
The common use cases for dashboards in logistics are off-the-shelf, ready-made software solutions. They can be deployed in small-scale quantities, and businesses can begin tracking performance almost instantly.
Best suited for:
- Startups and small- to medium-sized logistics businesses.
- Companies that need a rapid deployment.
- Teams with limited technical resources.
- Standard logistical reporting requirements.
Advantages
- Lower initial investment.
- Better implementation.
- Preset analytics and template-based.
- Support and updates are provided by the vendor.
- In off-the-shelf, there are no choices.
- Limitations in integration with existing tools.
- Fees increase with time.
- Smaller operations may be less flexible.
Challenges:
How to Choose the Right Logistics Analytics Dashboard for Your Business?
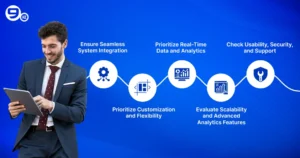
The right Logistics Analytics Dashboard can influence how smoothly your logistics operations run. The ideal solution should give you not just a visual representation of data, but help your staff make more informed, faster decisions. The 5 factors to keep in mind when buying a business dashboard are:
1. Ensure Seamless System Integration
Choose a dashboard that is easy to integrate into your existing systems, including TMS, WMS, ERP, and tracking software. Seamless integration with analytics software for SKU level performance tracking ensures accurate data synchronization, automated workflows, improved inventory accuracy, enhanced profitability, and a clearer operational view.
2. Prioritize Customization and Flexibility
Your operations staff, managers, and executives need different insights. Select a platform where you can add or change KPIs, reports, and dashboards for each user, so they can focus on what they want.
3. Prioritize Real-Time Data and Analytics
An efficient dashboard should provide visibility into shipments, stock, and performance in real-time. Live data helps teams to respond quickly to disruption rather than immediately to problems.
4. Evaluate Scalability and Advanced Analytics Features
As you go, more logistics activity will take place, and the dashboard must evolve in response to the growing data and operational complexity. There are features to watch out for, like predictive analytics, automated reporting, and performance forecasting.
5. Check Usability, Security, and Support
The logistics data analytics platforms with customizable dashboards should be easy to use and well serviced for the customers. Role-based access control and strong data protection ensure safe collaboration across teams and safeguard sensitive information.
Conclusion
Logistics Analytics Dashboard is now an essential resource for organizations aiming to develop smarter, faster and more resilient supply chains. As you can see, analytics-driven analytics bring many benefits to logistics management because they help businesses view performance, measure KPIs, reduce operating costs, and make informed decisions by turning complex logistics information into actionable insights. Analytics-driven dashboards provide visibility at scale, from real-time to AI-based predictive insights, moving logistics teams from reactive problem-solving to strategic optimization.
Build Your Logistics Analytics Dashboard
Talk to our Experts
Talk to Our Logistics Experts
With the complexity of logistics evolving, the option to invest in customizable, data-driven analytics tools is no longer an optional feature, but a competitive advantage. Today’s businesses that use modern analytics in logistics can improve delivery, better satisfy customers, and run their businesses more effectively.
The NineHertz can help you make that vision a reality. We are a logistics software development company with over 15 years of experience and cutting-edge technologies that create custom software, data analytics, and enterprise solutions. Our team of 250+ app developers can help you create scalable and custom logistics dashboards that fit your business needs. The right technology expert can not just capture data, but also unlock its full potential to inform smarter logistics decisions and sustainable growth.
FAQs
1. What is a Logistics Analytics Dashboard?
A Logistics Analytics Dashboard is a visual format for gathering and displaying information about logistics in one place. It provides real-time visibility into shipment, performance and decision making rather than reports.
2. What is an example of a KPI in logistics?
One common logistics KPI is the on-time delivery rate, which measures how many shipments get to customers in the agreed-upon timeframe. Companies use this metric to measure delivery efficiency and customer service.
3. How does AI improve a Logistics Analytics Dashboard?
AI enhances the logistics dashboard by using historical and real-time data to anticipate delays, changes in demand, and operational risks. It enables a team to make intelligent decisions, plan routes, and eliminate problems before they arise.
4. What is the difference between a standard reporting tool and a Logistics Analytics Dashboard?
AI improves retail supply chain management software by enabling advanced demand forecasting using historical sales, weather data, promotions, and regional trends. It detects anomalies in stock reconciliation instantly and generates intelligent stock rebalancing recommendations across locations. These capabilities improve forecasting precision, reduce discrepancies, and enhance overall inventory optimization.
Great Together!
Latest Blogs

Real-Time Cold Chain Monitoring Architecture for Pharma and Food Logistics
Key Takeaways Post-delivery excursion discovery is a governance architecture failure, not a process gap. Passive data loggers cannot generate corrective…
How Enterprises Eliminate Manual Dispatch: Intelligent Load Assignment, Driver Orchestration
Key Takeaways Manual dispatch is an architecture failure, not a process problem. Spreadsheets and phone trees are a missing coordination…

Beyond the GPS Dot: Building Predictive ETA Intelligence for Enterprise Logistics Operations
Key Takeaways GPS enables the fleet managers to track the real-time location of the vehicle, without visibility into the estimated…