Subscriber Churn Intelligence Architecture for OTT Platforms: How Behavioral Telemetry and Predictive Scoring Enable 30-Day Early Intervention

- OTT platforms now face monthly subscriber churn rates of 5.5%, nearly triple the 2% recorded in 2019, and 44% of paid US subscribers cancel within their first year of service.
- Monthly cohort reports only confirm cancellations that already happened. Behavioral signals like session frequency collapse and content completion decline surface 21 to 45 days before the subscriber actually hits cancel.
- The Subscriber Lifetime Value Protection Model (SLVPM) is a five-layer intelligence architecture that connects behavioral telemetry, ML-based scoring, and intervention routing to CRM, billing, and content systems in real time.
- Voluntary, passive, and quality-induced churn each follow different behavioral patterns and require distinct intervention strategies. One retention campaign cannot address all three.
- Voluntary, passive, and quality-induced churn each follow different behavioral patterns and require distinct intervention strategies. One retention campaign cannot address all three.
Every OTT platform executive has seen the same spreadsheet. The monthly churn report arrives, the numbers are worse than expected, and the team spends a day figuring out what happened. The honest answer, though, is that it already happened weeks ago. Subscribers do not cancel impulsively. They drift first. Session by session, search by search, until one evening they open a competitor instead and just never come back. The cancellation button is almost an afterthought at that point.
Subscriber churn intelligence architecture is the integrated data pipeline, behavioral telemetry layer, and machine learning scoring system that catches those drift patterns 21 to 45 days before the subscriber formally cancels. Unlike monthly cohort reporting, it runs continuously, connecting viewing behavior to retention actions in near real time, before the revenue walks out the door.
The scale of the problem is worth sitting with for a moment. Monthly SVOD churn hit 5.5% by early 2025, up from 2% in 2019. Parks Associates found that 44% of paid US OTT subscribers are gone within their first twelve months. Deloitte put it another way: 39% of consumers had dropped at least one SVOD service in the previous six months. And acquiring a replacement subscriber costs five to twenty-five times what it would have cost to keep the one who left. The math does not favor platforms that wait for the cancellation to show up in a report.
Identify at-risk subscribers before they cancel and improve retention.
Why Monthly Churn Cohort Reports Always Arrive Too Late to Act On?
The Reporting Lag That Converts Preventable Cancellations Into Confirmed Revenue Loss
Here is how the timeline actually plays out. A subscriber cancels on day 8 of the month. The billing system logs it. The cohort report captures it at the month’s end. The product team reviews it on day 35. By that point, the subscriber has been watching something else for four weeks. There is no intervention to run. There is only a number to add to the slide deck.
That 27-day gap between cancellation and organizational awareness is not a reporting limitation. It is a structural failure, and it means every “preventable” cancellation in those cohort reports was actually confirmed the moment the platform chose retrospective analysis over real-time behavioral monitoring.
How Lagging Indicators Mask Behavioral Deterioration That Began 45 Days Earlier
Cohort reports aggregate. They tell you 5.3% of September subscribers churned. What they do not tell you: 68% of those subscribers had already cut their weekly viewing sessions by more than 40% in the six weeks prior. A meaningful slice of them searched for content three or more times without pressing play. Others had quietly stopped using the platform on their TV and were only opening it occasionally on mobile, for shorter and shorter stretches.
None of that shows up in the monthly number. Lagging indicators count exits. Behavioral telemetry reads the direction of travel before anyone reaches the door.
The Operational Cost of Reacting After the Cancellation Button Is Clicked
Post-cancellation win-back campaigns convert at roughly 15 to 20%. Proactive interventions, deployed while the subscriber is still active but showing early risk signals, convert at 60 to 80%. That gap is not marginal. On a base of several hundred thousand subscribers, the difference between those two conversion rates determines whether retention is a revenue-generating function or an expensive cleanup operation.
Transform behavioral telemetry into actionable retention insights.
The Acquisition-Retention Investment Asymmetry: Why $25 Per Subscriber Acquisition Gets $0 in Predictive Retention?
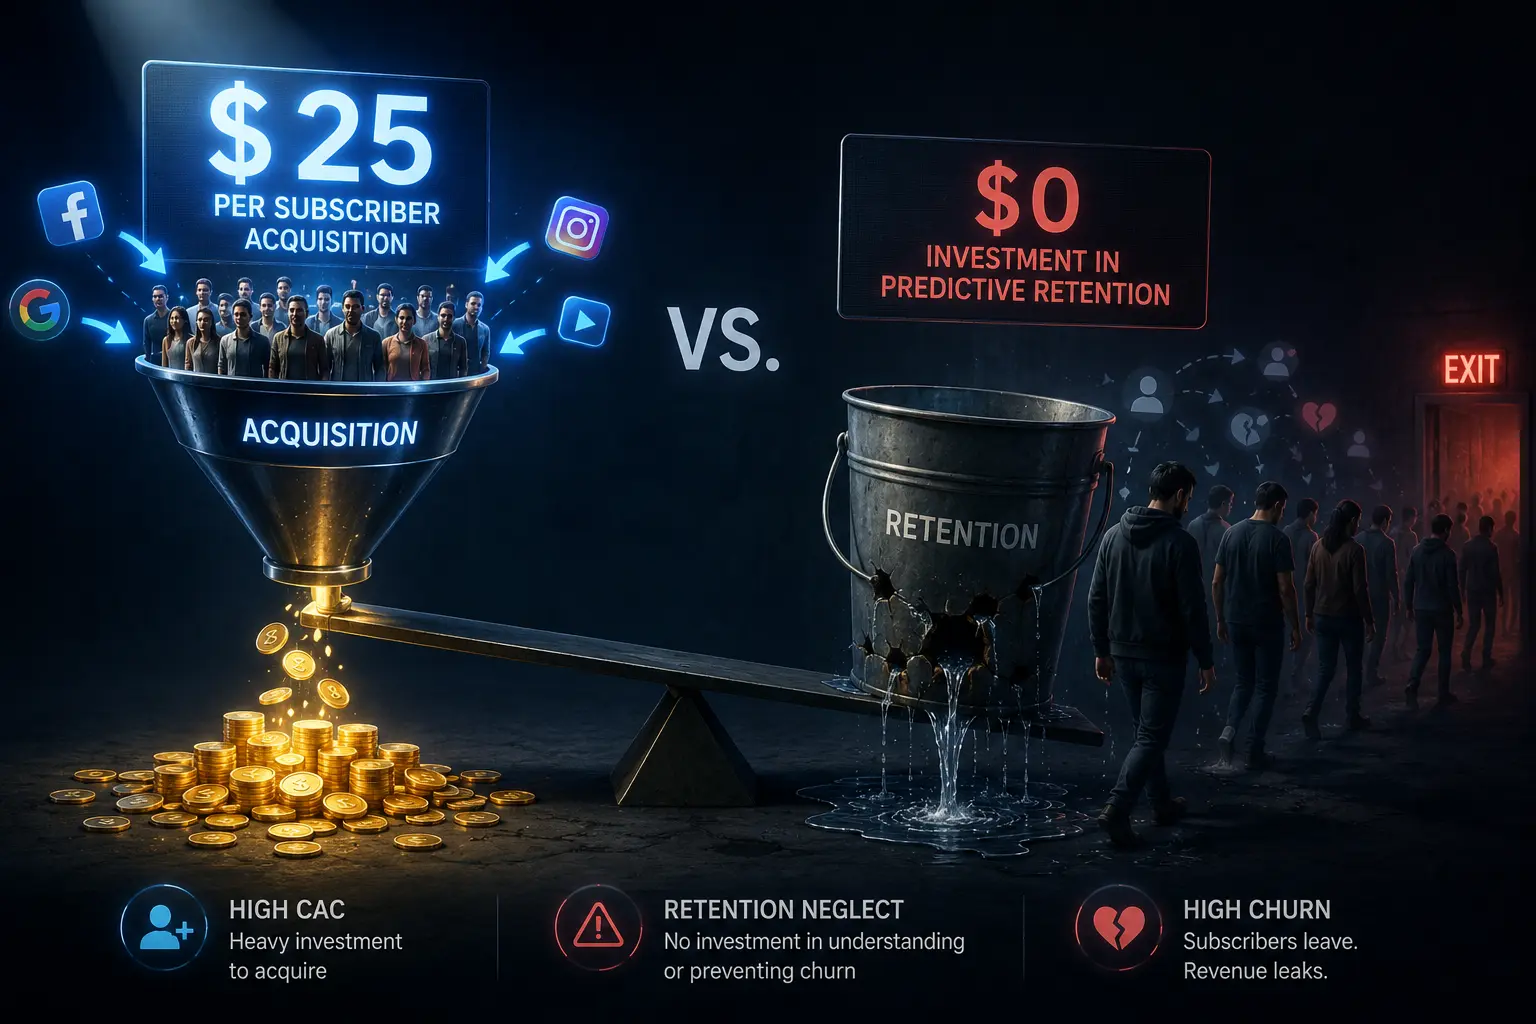
The Per-Subscriber Acquisition Cost vs. Zero Investment in Retention Intelligence
Netflix has historically spent around $88.60 per new subscriber. Smaller platforms spend $25 to $50. Acquisition has headcount, attribution dashboards, media budgets, and dedicated campaign teams. Retention, at most OTT companies, has a monthly spreadsheet and an email sequence that goes out to everyone who looked at the cancel button.
Research across subscription businesses puts the cost ratio clearly: keeping a subscriber costs five to seven times less than replacing one. Yet OTT retention infrastructure consistently goes underfunded while acquisition spend climbs. Platforms pour money into bringing subscribers in, then watch 44% of them leave within twelve months without a system in place to see it coming.
LTV Erosion as a Silent Unit Economics Crisis
A healthy LTV-to-CAC ratio is around 3:1, meaning a subscriber should generate three dollars in revenue for every dollar spent acquiring them. At 5.5% monthly churn, that math breaks down fast. Tenure shortens, LTV drops, and the platform has to spend more on acquisition just to stay flat. Retention intelligence is not a nice-to-have in that scenario. It is the only lever that protects the return on every acquisition dollar already spent.
The Five Pre-Churn Behavioral Signals That Surface 21 to 45 Days Before Cancellation?
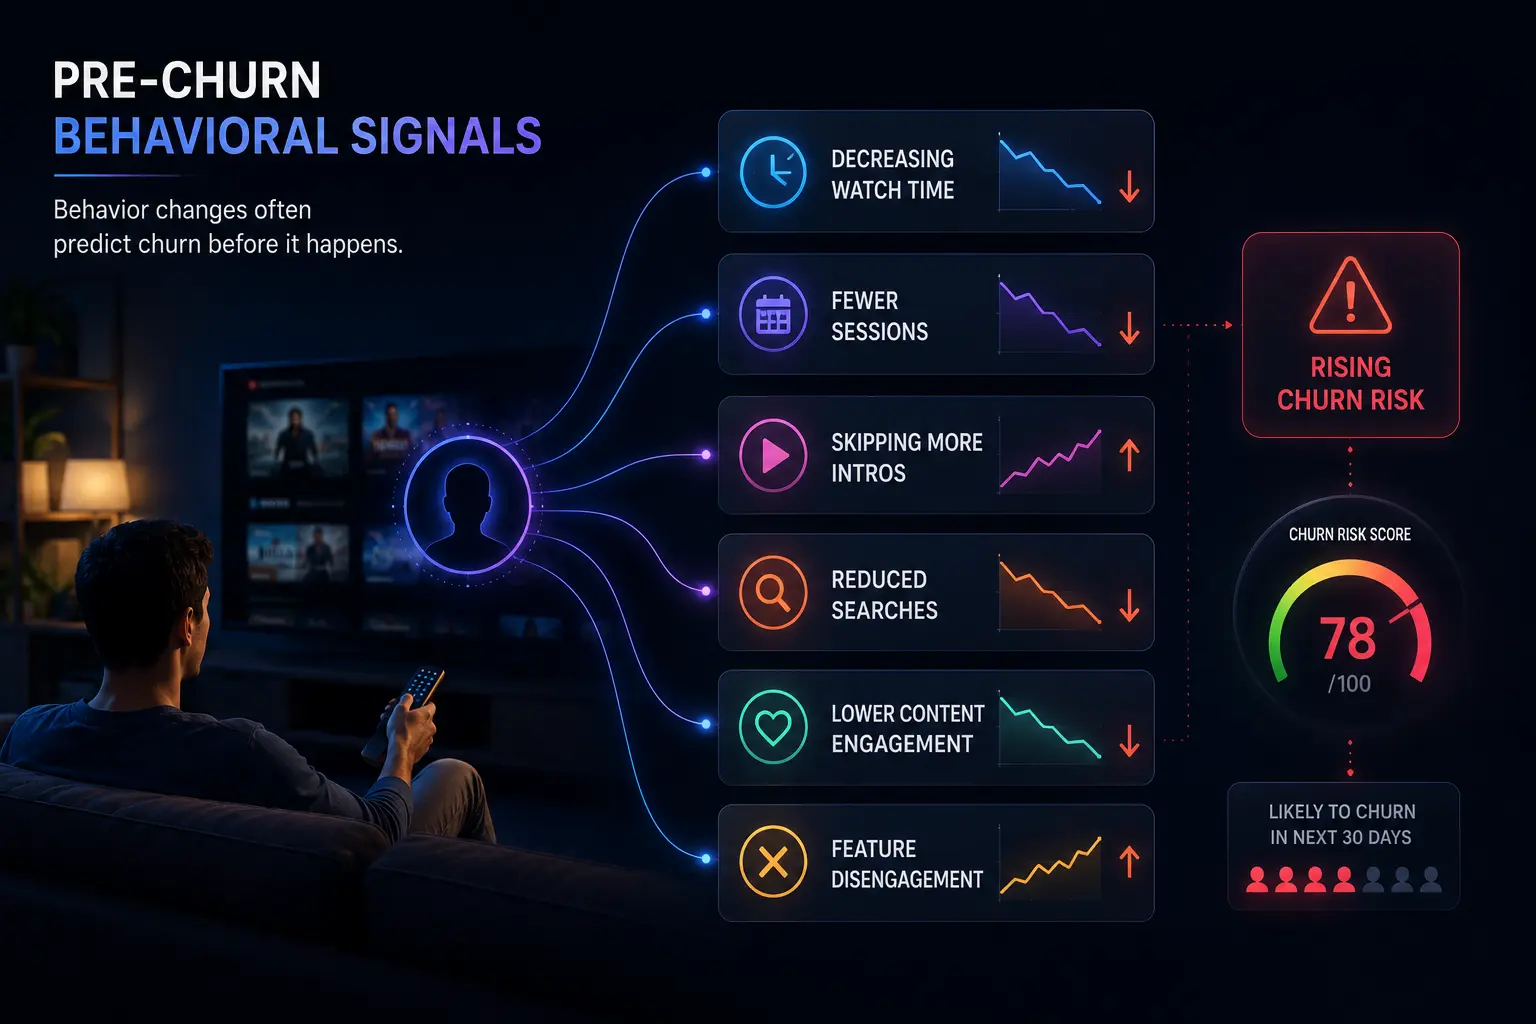
Churn starts as a pattern shift, not a decision. Behavioral telemetry picks up these shifts in real time, and ML models turn them into individual risk scores. Five signals show up consistently in the weeks before a subscriber leaves.
Signal 1: Viewing Session Frequency Collapse
A subscriber who watched five days a week, dropping to two is not just having a busy month. Week-over-week change in session frequency is a far stronger predictor than any single day’s viewing count. What matters is the trajectory, whether engagement is falling, holding, or recovering, not where it sits on any given Tuesday.
Signal 2: Content Completion Rate Decline
Starting an episode and abandoning it twenty minutes in is a different signal than never opening the app at all. A falling completion rate across a rolling 14-day window, especially when browsing time stays high, points to a specific problem: the subscriber is still trying to find something worth watching. They just keep coming up empty. The platform is losing the content relevance argument, and right now it has no idea.
Signal 3: Search-and-Browse-Without-Play Behavior
Opening the app, running three or four searches, scrolling through recommendations, and closing it without watching anything is a high-confidence pre-churn indicator. The subscriber has not given up yet, but the content surface is failing to convert their intent into a viewing session. Three of these sessions in a two-week window and the clock is already running.
Signal 4: Failed Payment Retry Without Re-engagement
A failed payment charge is not the signal. What happens in the 72 hours after is. Subscribers who experience a billing failure and do not log back in to update their payment details within three days rarely self-correct. They have either forgotten about the platform or, more often, they have decided the lapse is a convenient exit. The payment system and the retention system need to share that information, and most platforms have not wired them together.
Signal 5: Cross-Device Abandonment
Engaged subscribers watch on multiple screens. A shift to single-device usage, specifically shorter mobile-only sessions replacing the longer TV sessions, often shows up three to four weeks before cancellation. The subscriber is pulling the platform out of their daily routine incrementally. That shrinkage in footprint is real and measurable, and it is a cleaner early signal than almost anything else in the behavioral stack.
Leverage predictive analytics and automated intervention workflows.
Subscriber Lifetime Value Protection Model (SLVPM): Architecture of a Churn Prevention Intelligence System
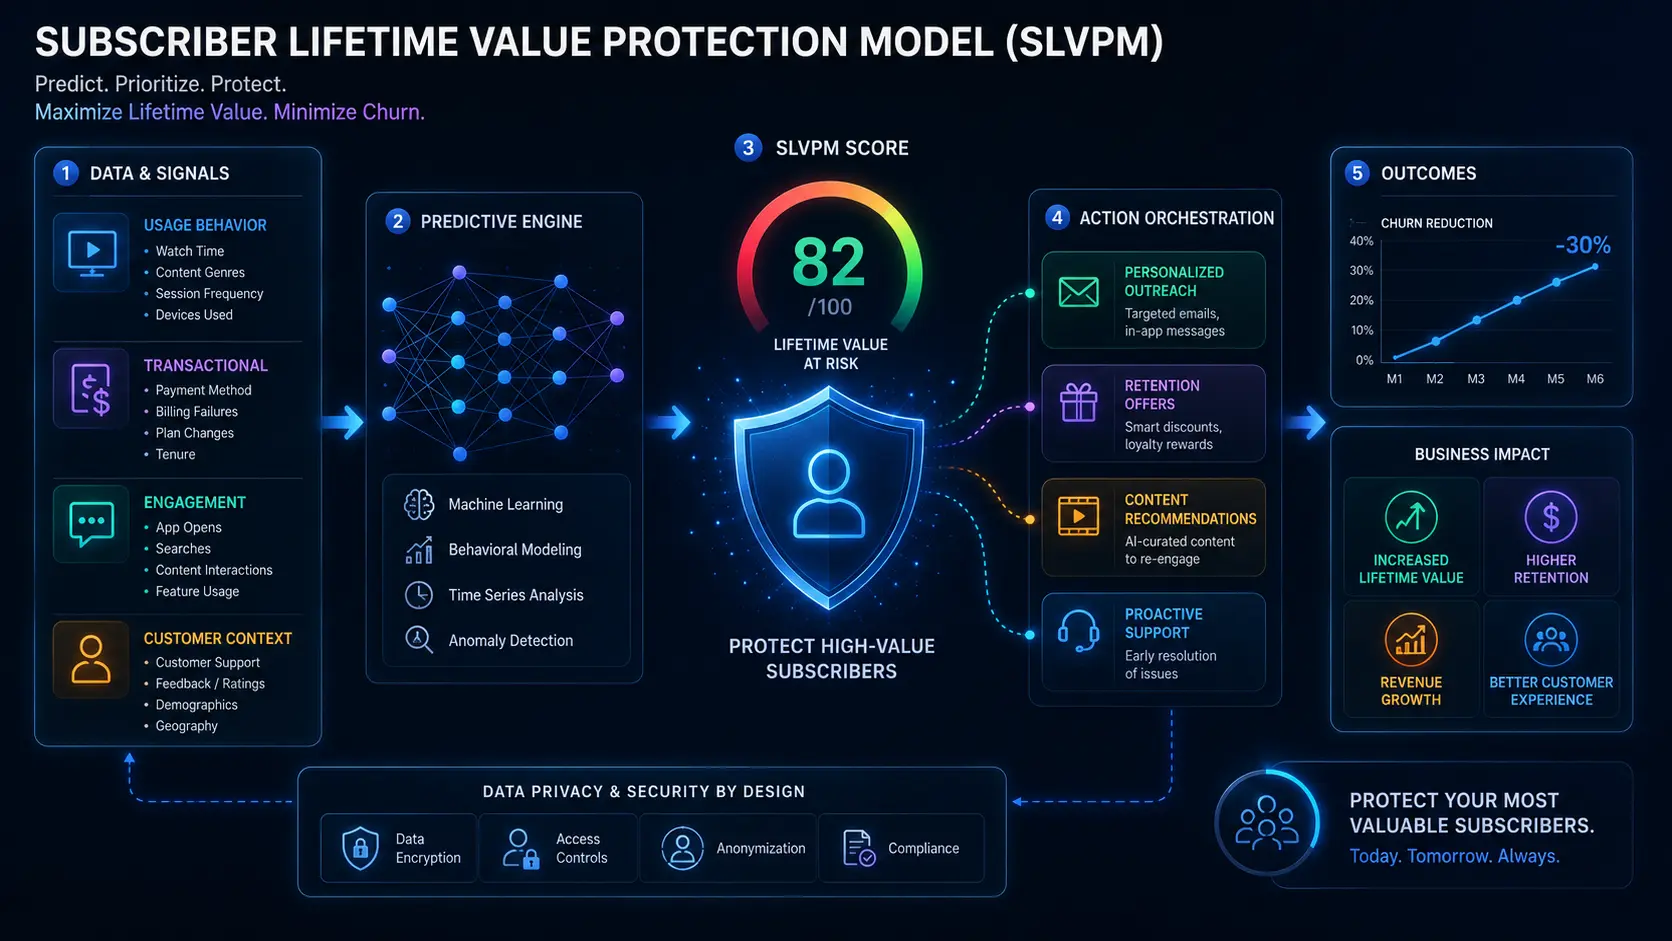
The SLVPM is a five-layer architecture that replaces monthly churn reporting with continuous, per-subscriber intervention capability. Each layer handles a distinct function, and the system runs as a pipeline, not a batch job.
| SLVPM Layer | Function | Key Components |
|---|---|---|
| Layer 1: Behavioral Telemetry | Real-time event capture from all subscriber touchpoints | Session events, playback signals, search logs, device metadata, QoE metrics |
| Layer 2: Feature Engineering | Transform raw events into derived predictive signals | Session velocity trends, completion rate trajectories, search-to-play ratios, cross-device patterns |
| Layer 3: Probability Scoring | Assign individual churn probability scores on a rolling basis | Gradient boosting models (XGBoost/LightGBM), weekly or daily scoring refresh, explainable risk drivers per subscriber |
| Layer 4: Intervention Routing | Route at-risk subscribers to the correct intervention type | Voluntary/passive/quality decision tree, score band thresholds, intervention priority queue |
| Layer 5: System Integration | Connect intelligence outputs to operational platforms | CRM sync, billing system triggers, content recommendation engine updates, push notification dispatch |
Architecture: From Data Ingestion to Intervention Dispatch
Layer 1 pulls every subscriber interaction into a structured event stream: viewing sessions, search queries, playback errors, billing events, device activity. All of it flows into a unified event bus. Speed matters here. A session frequency collapse from three days ago is still actionable. The same signal from three weeks ago is history.
Layer 2 is where raw events become useful features. Logins and clicks by themselves do not predict much. What predicts is the derived version: how session frequency has changed week over week, how current completion rates compare to that subscriber’s own historical baseline, how long it has been since a meaningful viewing session. These trajectory features capture which direction engagement is moving, and direction is what the model actually needs.
Layer 3 runs the scoring engine. Gradient-boosted models like XGBoost and LightGBM are the right starting point for OTT churn contexts. Research in the International Journal of Basic and Applied Sciences showed that a hybrid feature selection approach combined with ensemble ML methods reached 98% accuracy on OTT churn datasets. Scoring cadence matters: weekly is the minimum, but platforms with high subscriber velocity benefit from daily refreshes to catch fast-moving deterioration before the intervention window closes.
Layer 4 is the routing layer, where a score becomes a specific action. Each subscriber gets classified by churn type, then assigned to the right intervention queue. A voluntary churn case above 0.75 probability gets a personalized content push and a price lock option. A passive churn case goes to the payment retry sequence and account alert flow. The classification step is what prevents the platform from sending a content recommendation to someone whose card just expired.
Layer 5 is what makes the whole thing operational rather than academic. Scores and intervention assignments push to the CRM. Passive churn flags trigger the billing platform. Recommendation algorithms shift for at-risk subscribers. Notification dispatch sends the right message at the right time. Without this integration layer, a churn model is just a dashboard that nobody acts on.
Our experts build scalable churn prediction and retention systems.
Voluntary vs. Passive vs. Quality-Induced Churn: Why Each Requires a Different Intervention Architecture
Voluntary Churn: The Perceived Value Gap
Cost is the top reason subscribers cancel, cited by 45% of users in recent surveys. Content fragmentation across too many competing platforms is the second. Voluntary churn means the subscriber ran their own cost-benefit calculation and came out on the wrong side. Sending them a generic discount misses the point. What actually works is surfacing content they have not watched yet that fits their taste profile, offering to lock in their current price for another three months, or giving them a path to an ad-supported tier instead of a clean exit. The goal is to change the calculation, not just lower the price.
Passive Churn: The Involuntary Payment Failure Pipeline
Passive churn is mechanical: the card expires, the charge fails, and the subscription quietly lapses. Some of those subscribers do not even know they lost access. The intervention is completely different from voluntary churn. Smart dunning sequences, payment retries timed around typical paycheck cycles, and direct SMS or push alerts that create urgency around fixing the billing issue. Passive churn is the cheapest type to prevent, and most platforms still handle it with a single automated email.
Quality-Induced Churn: Streaming Degradation and UX Friction
Some subscribers love the content and hate the experience. Persistent buffering, slow startup times, confusing navigation, and repeated playback errors all push subscribers toward the door quietly. A subscriber who hits the same playback error twice in a week cancels at measurably higher rates within 30 days. QoE metrics, rebuffering ratios, startup latency, error frequency, need to feed directly into the churn scoring model. Right now, at most platforms, the QoE team and the retention team are not even in the same conversation.
Personalized Retention at Scale: How Individual Probability Scores Replace Demographic Campaigns
From Cohort-Level Campaigns to Per-Subscriber Precision
Most OTT retention campaigns work by putting subscribers into buckets and sending everyone in a bucket the same message. A subscriber who drifted away because nothing in the catalog matched her taste gets the same email as someone whose credit card expired and someone else who gave up after three buffering incidents in one week. None of those situations calls for the same response. Individual churn probability scores, paired with a driver-level explanation for why the score is high, let retention teams build interventions that actually match the problem.
Matching Intervention Type to Churn Probability Score Bands
| Score Band | Risk Level | Intervention Strategy |
|---|---|---|
| 0.00 to 0.30 | Low risk | Standard engagement: personalized content digest, new release notifications |
| 0.31 to 0.55 | Moderate risk | Value reinforcement: curated ‘unwatched for you’ collections, feature education (offline downloads, profiles) |
| 0.56 to 0.75 | High risk | Active retention: limited-time price lock, ad-tier downgrade offer, exclusive early access to upcoming titles |
| 0.76 to 1.00 | Critical risk | Urgent intervention: direct outreach, personalized discount, concierge-level support, exit survey with save offer |
The intervention should escalate with the score, not with the calendar. A subscriber sitting at 0.80 on day 3 of their risk window needs an action today, not a drip sequence that plays out over two weeks.
Retention Offer Architecture: Content, Price, and Downgrade Paths
The best retention offers do not feel like retention offers. A recommendation of five titles the subscriber has never watched but will almost certainly enjoy does not read as desperation. A three-month price lock offer arrives as a reward, not a discount signal. A path to an ad-supported tier gives the subscriber an exit from the price problem without an exit from the platform. The data backs this: 61% of new SVOD sign-ups in Q1 2024 chose ad-supported plans. Subscribers will take a worse deal over no deal if you give them the option before they have already decided to leave.
Related Articles:
OTT App Development Companies
OTT App Risk Security
AI in OTT Streaming Platforms
Integration Architecture: Connecting Subscriber Intelligence to CRM, Payment, and Content Systems
A churn model that only lives in a data warehouse is not a retention system. The SLVPM only works once its outputs are wired into the platforms that actually touch subscribers.
- CRM Integration: Updated risk scores and intervention assignments push to the CRM on every scoring cycle. A retention rep opening an account should see ‘primary driver: 62% decline in session frequency over 21 days,’ not a color-coded risk badge. The driver is what tells them what to say.
- Payment System Integration: Passive churn flags go directly to the billing platform, triggering smart retry sequences tuned to common payment processing windows. Retry logic should also adapt by failure reason. An expired card needs a different approach than a declined charge from a card that is still active.
- Content Recommendation Engine: For voluntary churn cases, the recommendation algorithm shifts to prioritize undiscovered, high-affinity titles over trending content. The subscriber already knows what is trending. What they need is something they have not seen yet that fits how they actually watch.
- Notification Dispatch: Outreach goes out when the subscriber’s risk trajectory says it should, not when a campaign calendar says it should. A well-timed push notification during an active risk window outperforms a scheduled blast to the full subscriber base by a significant margin.
ROI Model: LTV Recovery from Predictive Retention vs. Equivalent Acquisition Investment
The Conversion Math: Proactive vs. Reactive Retention
Run the numbers on a platform with 500,000 subscribers and a 5.5% monthly churn rate. That is 27,500 subscribers at risk every single month. Proactive intervention on half of them, with a 70% save rate, recovers 9,625 subscribers per month. At $12 average monthly ARPU, that is $115,500 in recovered revenue from one month’s cohort alone. Annualized, it gets to $1.39 million from a single month’s intervention activity. Stack twelve months of that and the numbers become very hard to ignore.
Calculating LTV Recovery Per Intervention Window
Saving a subscriber at month four is not just one month of ARPU. A subscriber who stays for another twelve months after that intervention contributes twelve months of revenue that would have been lost. They also generate word-of-mouth, they reduce the pressure on acquisition targets, and their engagement data improves the platform’s position when negotiating content deals. The LTV recovery from a single successful intervention compounds in ways that a standard revenue dashboard does not capture.
Platform-Level ROI: How a 2% Churn Reduction Compounds Into Annual Revenue Recovery
Pull monthly churn down from 5.5% to 3.5% on a 500,000-subscriber base. That is roughly 10,000 additional subscribers retained each month. Over twelve months, accounting for compounding, the net subscriber base sits 80,000 to 100,000 higher than the high-churn scenario. At $12 ARPU, the annual revenue gap is $11.5 million to $14.4 million. Acquiring those same 100,000 subscribers would cost $5 million at $50 each, and 44% of them would churn within a year anyway. The retention investment wins on every dimension.
Frequently Asked Questions
What data does an OTT churn prediction model need to operate effectively?
Five data types drive most of the predictive signal: viewing behavior (session frequency, watch duration, completion rates), billing history (payment status, plan tier, failed transactions), content interaction data (searches, browse patterns, genre affinity), device and QoE data (which devices, playback error rates, buffering frequency), and tenure signals (signup date, pauses, plan changes). A model built on all five consistently outperforms one that only uses viewing data, because billing and QoE signals catch the churn types that watch-time metrics miss entirely.
How far in advance can subscriber churn be accurately predicted?
Thirty days is achievable with a well-built model, and 21 to 45 days is the typical range where behavioral signals become strong enough to act on. The tradeoff worth knowing: a model tuned for early detection at six weeks may flag some false positives, but a model that only catches churners three days before cancellation is nearly useless for intervention. Earlier and slightly less precise beats later and highly precise in retention contexts.
What is the difference between voluntary, passive, and quality-induced OTT churn?
Voluntary churn is a deliberate decision, the subscriber decided the platform is not worth what they are paying. Passive churn is a billing failure where the subscriber may not even realize they lost access. Quality-induced churn happens when the experience itself, buffering, errors, navigation frustration, drives someone away from content they would otherwise keep watching. Each type requires a completely different response, and a platform that treats all three as one problem will underperform on all three.
How does a subscriber churn intelligence system integrate with existing CRM and billing platforms?
The integration runs on API connections and event-driven triggers. Risk scores and intervention assignments sync to the CRM on each scoring cycle. Passive churn flags push to the billing platform and initiate dunning sequences automatically. Recommendation algorithm parameters update based on at-risk classification. Notification systems pull from the intervention routing queue rather than a marketing calendar. Most platforms already have the CRM and billing infrastructure in place. The work is connecting the scoring layer to systems that are already there.
What ROI should OTT platforms expect from predictive churn prevention?
On a 500,000-subscriber platform running 5.5% monthly churn, a 2-percentage-point reduction recovers between $11 million and $14 million annually. Proactive retention saves 60 to 80% of intervened subscribers. Reactive win-back campaigns save 15 to 20%. The infrastructure cost to build and maintain the scoring and routing layer is a fraction of either figure. Platforms that have run the numbers generally find it is the highest-ROI engineering investment available to a growth-stage OTT business.
Great Together!
Latest Blogs
Challenges and Tricks for iBeacon App Development
In this current era, it is easier to locate a food court or a mall using GPS/location based services. But…

How Broken Media Supply Chain Architecture Costs OTT Platforms Millions in Launch Delays, Rights Violations, and Re-Encoding Waste
Key Takeaways OTT platforms bleed days - sometimes weeks - of subscriber revenue when fragmented media supply chains push content…
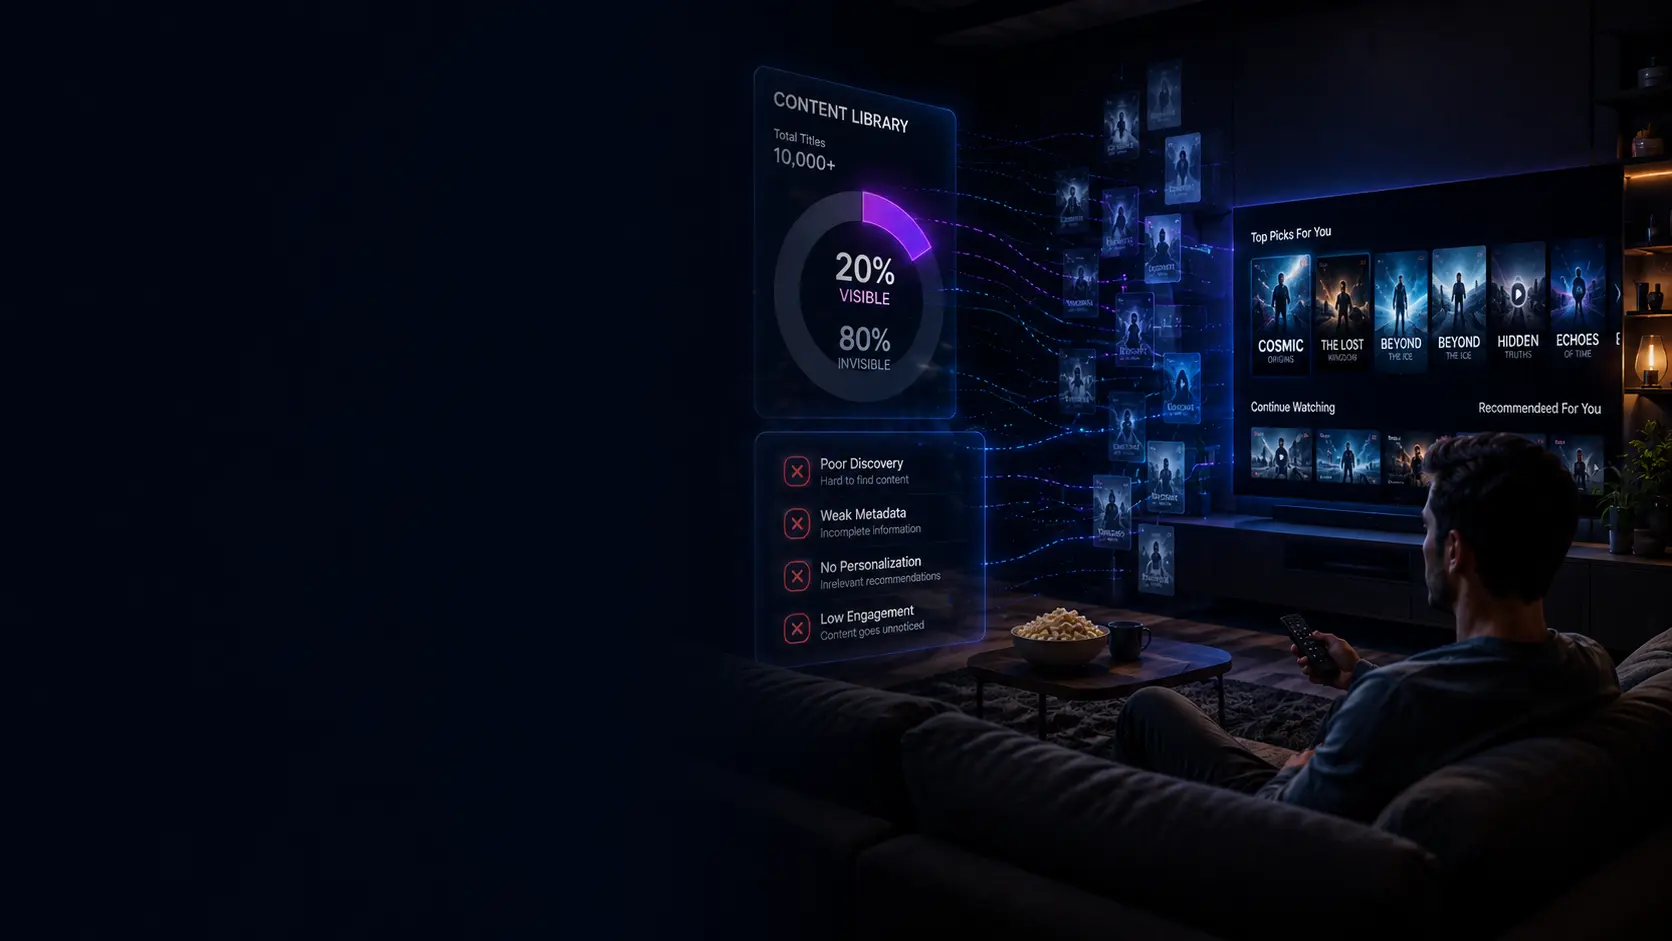
Why 80% of Your Content Library is Invisible to OTT Subscribers?
Quick Answer: Content intelligence architecture is the data infrastructure layer that connects subscriber behavior, content metadata, and catalogue performance signals…