Is R Better Than Power BI? A Complete Comparison (2025)

Is R better than Power BI? R vs Power BI tools are on the priority list when choosing the ideal tool for statistical analysis and visual creation. While Power BI is the primary choice when the preference is ease of use and accessibility, R seems to be leading the scenario for complex statistical computation and custom visualization. Power BI enables users to build dashboards and interactive reports with advanced Power BI services like real-time data analysis and collaborative sharing. Talking about the statistics, Microsoft Power BI stands out as one of the leading Business Intelligence Technologies in 2024, commanding an impressive 15.67% market share.
Still, when turning toward the user community, Power BI is performing better than R. In this blog, we will talk about both the tools, the features, teamwork capabilities, and their ability to handle large datasets while ensuring real-time processing.
Is R Better Than Power BI?
One of the best way to find out the better one in this battle is by comparing the strength of the core competencies and the strength of both the tools.
- Power BI: It is popular for its ability to create user-friendly data visualization quickly. It helps the developers build an interactive dashboard that can be easily accessed by users who don’t have good technical expertise.
- R: It seems to be taking the leading position when it comes to detailed statistical analysis and complex modelings. However, the intricate nature of R might put some of the non-technical users into trouble.
Talking about the monetization model, both tools are available with their free version. However, if you want to leverage the enhanced capabilities and advanced data analytics for our business, you can surely shift to Power BI premium. Similarly, there are paid versions of R as well which fosters the in-depth analysis for the users. The extensive visualization tools provided by Power BI often make a friendly choice for users looking to streamline the data processes.
Power BI is the right choice for those who are looking for a powerful business intelligence solution. The industry-leading giants like Mark & Spencer, Coca-Cola, and Adobe rely on the core competencies of Powe BI for their data analysis needs.
What is Power BI?
Power BI also known as Power Business Intelligence is a Microsoft power platform that enables businesses or users to visualize tier data data and present the insights in a simpler form to drive informed decision-making.
The robust capabilities and user-friendly interface of Microsoft Power BI help businesses coming from different industries to create powerful visualizations, share easy-to-understand insights with their stakeholders, and use data to make future predictions.
Features of Power BI

There are various features of Power BI, some of which are discussed below:
1. Artificial Intelligence
The users can easily access the AI-powered image recognition and text analytics systems in Power BI.
2. Hybrid Deployment Support
There are in-built connectors that enable the Power BI tools to connect with a range of different data sources from Microsoft as well as other vendors.
3. Quick Insights
The user can easily create the subsets of the data and then apply the analytics to that data automatically.
4. Common Data Model Support
It helps Power BI to use the standardized collection of data schemas like attributes, entities, and relationships.
5. Customization
The users can easily customize their default visualization and reporting tools and then import the new tools into the platforms.
Power BI Use Cases
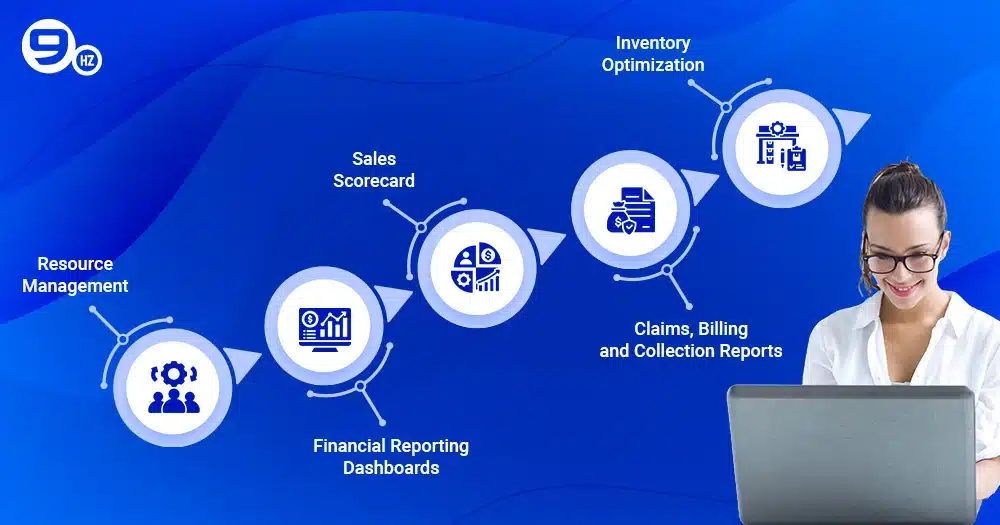
1. Resource Management
With Power BI, the user can allocate the resources wisely on the task assignments and make better decisions with visually available data.
2. Financial Reporting Dashboards
The dynamic dashboards help to streamline the financial tracking and offer a clearer view of cash flow and sales.
3. Sales Scorecard
The customizable scorecards help in analysis by products, and team members, and thus drive better business insights.
4. Claims, Billing, and Collection Reports
One of Power BI use case is it helps in identifying the current trends and streamlining the business processes to minimize losses while increasing customer satisfaction.
5. Inventory Optimization
With Power BI, the user can easily generate insights on purchasing ratios, stock turnover, and deadstocks for better inventory management.
Get More from Your Data with Custom Power BI Solutions
Turn your data into clear, useful reports with personalized Power BI dashboards
What is R?
R is a powerful programming language that is particularly designed for data visualization and statistical computing. The tools are mostly used by data scientists, academic researchers, statisticians, and professionals as they can perform complex data analysis.
While it is greatly helpful to play with the huge data, it seems to be losing the deal when it comes to use and making the data look more user-friendly to drive informed decision-making.
Key Features of R
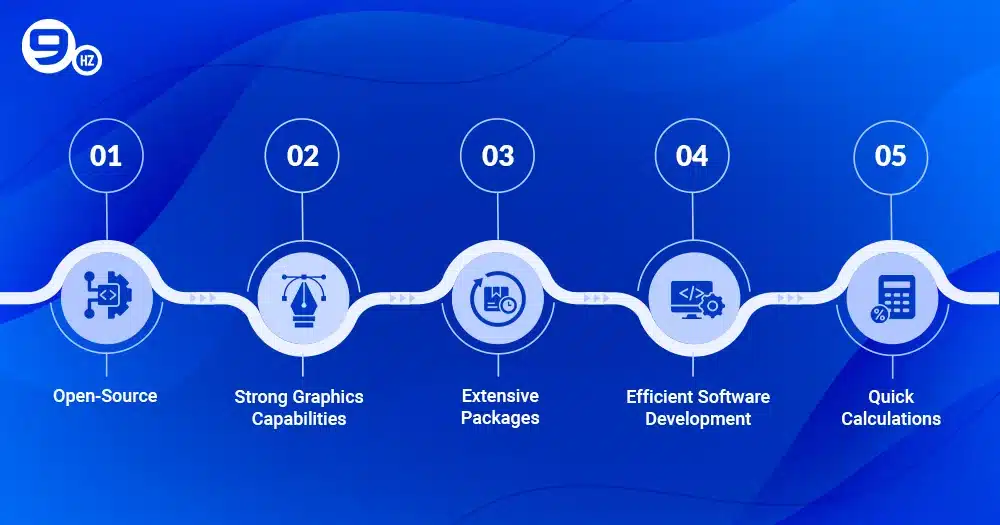
Here are some of the features that you can leverage with the R programming language-
1. Comprehensive Statistical Analysis
There are a range of statistical analysis techniques like linear and nonlinear modeling, time-series analysis, and clustering that you can use with R.
2. Advanced-Data Visualization
R can help in creating complex and aesthetically pleasing data visualizations with packages like ggplot2, lattice, and plotly.
3. Extensive Libraries and Packages
CRAN which stands for Comprehensive R Archive Network hosts thousands of packages to increase the R’s capabilities in ML, data manipulation, bioinformatics, etc.
4. Open Source
This is a free programming language that can be used by everyone. Being an open network platform, it garners community contribution and constant improvements.
5. Easy Integration
R language can be easily integrated with a range of other programming languages like C++, C, Java, SQL, Python, etc.
R Use Cases
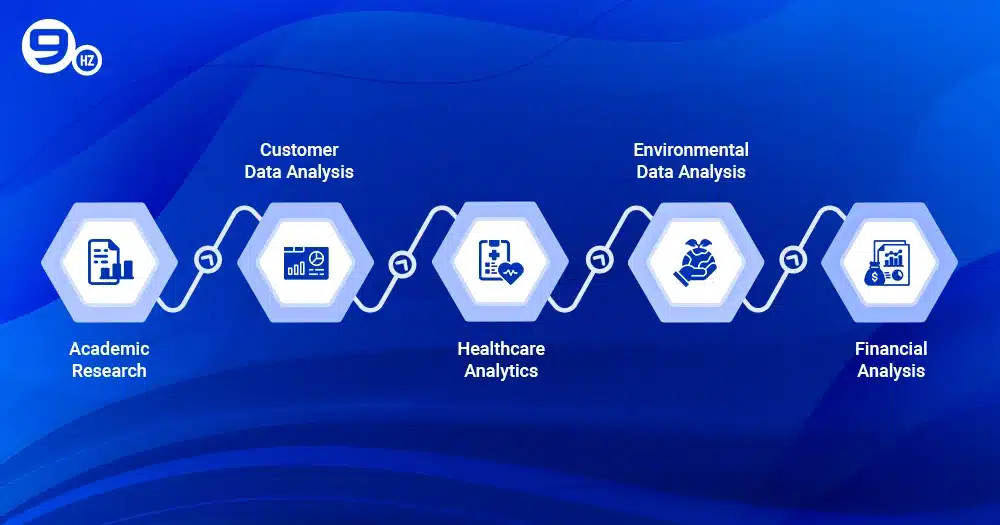
1. Academic Research
R helps academic scholars in statistical analysis, data visualization, and experiments by displaying the findings in an easier way.
2. Customer Data Analysis
R helps to analyze customer insights and thus enables businesses to craft custom marketing strategies.
3. Healthcare Analytics
By assessing the patient’s clinical data, it can develop predictive models to increase treatment efficiency.
4. Environmental Data Analysis
Analyzing the ecological and climate data, aids in visualizing and modeling environmental changes.
5. Financial Analysis
R is a fundamental tool that helps in facilitating data clearing, quantitative analysis, and financial modeling.
Key Differences Between Power BI and R
Depending on the key differences between the tools, it becomes easy to identify the one that might fit better according to the particular needs of the businesses. Have a glance over the table that states differences based on multiple factors-
| Feature | R | Power BI |
|---|---|---|
| Ease of Use | Generally required training and previous experience to use effectively | Very easy to use and helps to create dashboards without significant technical knowledge |
| Flexibility and Customization | Advanced tools are available to craft visuals but require in-depth expertise | Ready-made visuals are available which can be easily customized without much technical knowledge |
| Data Handling and Analysis | Complicated to set up but efficient for complex data analysis | Processes the data quickly to provide useful insights |
| Visualization and Reporting | Requires ample coding experience to create insightful visuals | It is easier to create attractive and interactive reports which is suitable for all businesses |
| Integration and Ecosystem | Compatible with various tools in the presence of coding knowledge | Can connect to the different data sources and tools easily to increase usability |
| Cost and Accessibility | Free to use but have to pay for the premium versions | The free version comes with tons of features while the paid version provides excellent value for money |
What Are The Advantages of Power BI over R?
If you are confused about the benefits of Power BI over R, the following points will help you make a decision-
- It is easier with Power BI to bring the data from different sources in a user-friendly manner
- Power BI beats R in terms of personalization where the user can customize the dashboard and reports to meet their particular preferences
- One easily craft the geo-maps that help in the easy interpretation of data spatially
- Question-and-answer is the unique feature of Power BI that facilitates seamless data analysis and discovery without needing advanced programming skills
- New functionalities are updated more frequently in Power BI which helps businesses to sync steps with the evolving technical landscape
Improve Your Business with Expert Power BI Help
Get expert advice to make the most out of Power BI for your business.
Why Choose The NineHertz as Your Power BI Consulting Partner?
The NineHertz is a Power BI Development Services Partner for a range of businesses around the world, helping them to impart automation and increase the productivity of their workforce. We craft the solutions by taking care of the customized needs of businesses and current time challenges faced by the clients. Under our services, we focus on creating easy-to-use dashboards and interactive reports that further drive informed decision-making among businesses.
Moreover, NineHertz ensures a smoother transition to Power BI by connecting all the current data sources to the new system. We establish the relationship with our clients for the longer run and thus we also provide ongoing support and online services to promise the durability of the system. Each of our solutions is built while taking care of certain quality standards for our clients.
Summary
When talking about Power BI and R, Power BI can be observed to overtake R in many arenas. While there is no doubt that R provides a stronger statistical function, it can only be used by professionals carrying in-depth knowledge about the technical landscape.
Ultimately, for those who value simplicity and strong visual presentation, Power BI proves to be the top option, making it the preferred tool for reliable data analysis.
Frequently Asked Questions (FAQs)
How Do Power BI and R Studio Differ?
Power BI and R are dedicated to performing different tasks in data analysis. R Studio is the programming environment that helps in performing the statistical analysis. It is the ideal solution for complex data analysis and data manipulation. Power BI, on the other hand, is a more user-friendly tool in the form of a graphical user interface that helps users create dashboards and interactive reports with minimum coding requirements. This tool is more suitable for those with limited technical expertise and who want accessible data visualization.
Are R and Python Comparable?
Both R and Python are the popular languages for data analysis. However, both languages have a different user base. While is R mostly adopted due to its statistical analysis capabilities and thus is used by scientists and statisticians, Python, on the other hand, is mostly preferred by the users looking for flexibility and versatility. Along with supporting data science, R also helps in web development and automation. At the same time, there is a user group that finds Phython’s syntax simpler and broader than R.
Can R be Used with Power BI?
Yes, R can be integrated into Power BI. It enables the users to use the R code and scripts or visualization and advanced calculation while increasing the analytical power of Power BI simultaneously. However, the integration requires technical knowledge, and thus, Power BI is preferred for easy analysis without coding.
Which Is Superior for Data Visualization: R or Power BI?
Power BI is superior to R when it comes to presenting the data visually and appealingly. Power BI has an easy-to-use interface that connects seamlessly with external data sources. The core competencies of Power BI help the users craft the data visuals quickly. So, businesses can easily present their data in the form of visuals to make it easy to understand for the relevant stakeholders. Similarly, there are many other reasons that make Power BI superior to R in different arenas.
Great Together!
Latest Blogs

15+ Best Photography NFT Marketplace (2026)
The NFT marketplace for photography is known to have boomed since the last year, i.e. 2024. And now, even more,…

How will Metaverse NFT Change Gaming?
Virtual games are the best thing that has happened to the gaming industry. With advanced technology and virtual gaming, unexpected…
![50+ Best NFT Tokens & Coins to Buy [Non Fungible Tokens List]](https://theninehertz.com/wp-content/uploads/2022/03/most-popular-nft-tokens.jpg)
50+ Best NFT Tokens & Coins to Buy [Non Fungible Tokens List]
Wall Street has been paying close attention to non fungible tokens List (NFT cryptos). Prices of many top NFT tokens…